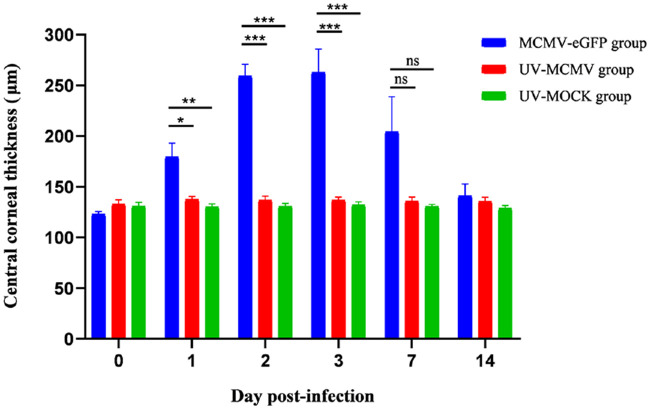
Figure 3.
Changes in the CCT in the rats of different groups by AS-OCT. N = 8 rats in every group; Short bar (comparison of the CCT between the MCMV-eGFP group and the UV-MCMV group by t-test); Long bar (comparison of the CCT between the MCMV-eGFP group and the UV-MOCK group by t-test); *P < 0.05; **P < 0.01; ***P < 0.001; CCT, central corneal thickness; AS-OCT, anterior segment optical coherence tomography.

