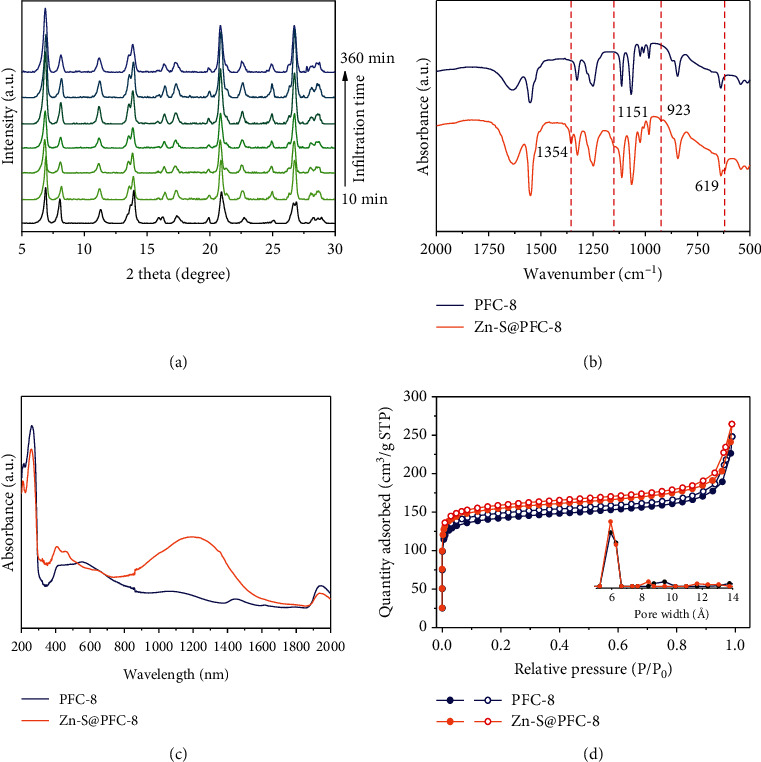
Figure 1.

(a) Time-dependent PXRD patterns of PFC-8 upon Zn-S2- infiltration. (b) IR spectra of PFC-8 and Zn-S@PFC-8. (c) UV-Vis-NIR spectra of PFC-8 and Zn-S@PFC-8. (d) N2 isotherm curves of PFC-8 and Zn-S@PFC-8. Inset: the pore size distribution of PFC-8 and Zn-S@PFC-8.
