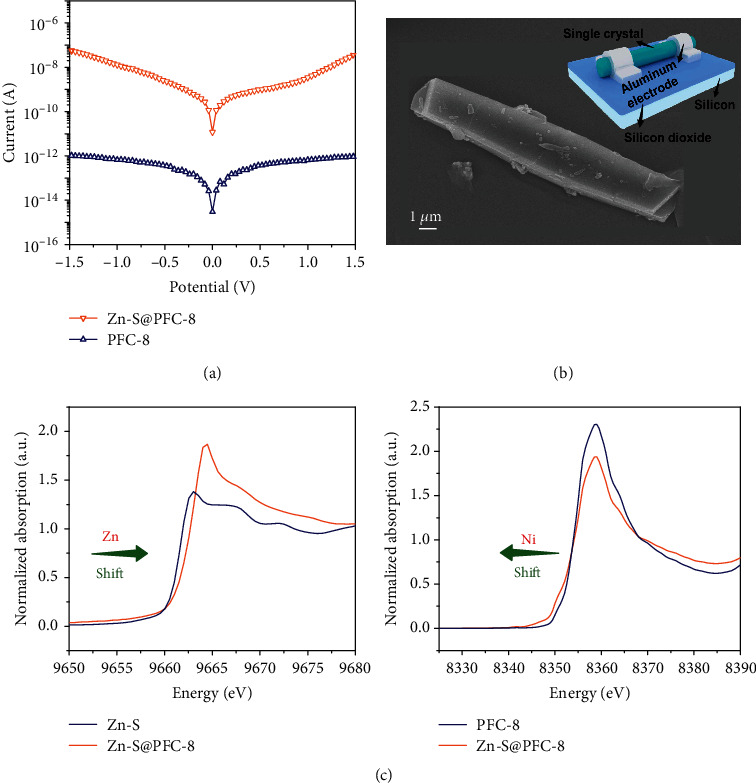
Figure 3.

(a) I–V characteristics of PFC-8 single crystal before and after Zn-S2- loading at 25°C. (b) SEM image of Zn-S@PFC-8. The inset shows the schematic diagram of the two-probe method. (c) The normalized XANES spectra at Zn and Ni K-edge of PFC-8 and Zn-S@PFC-8.
