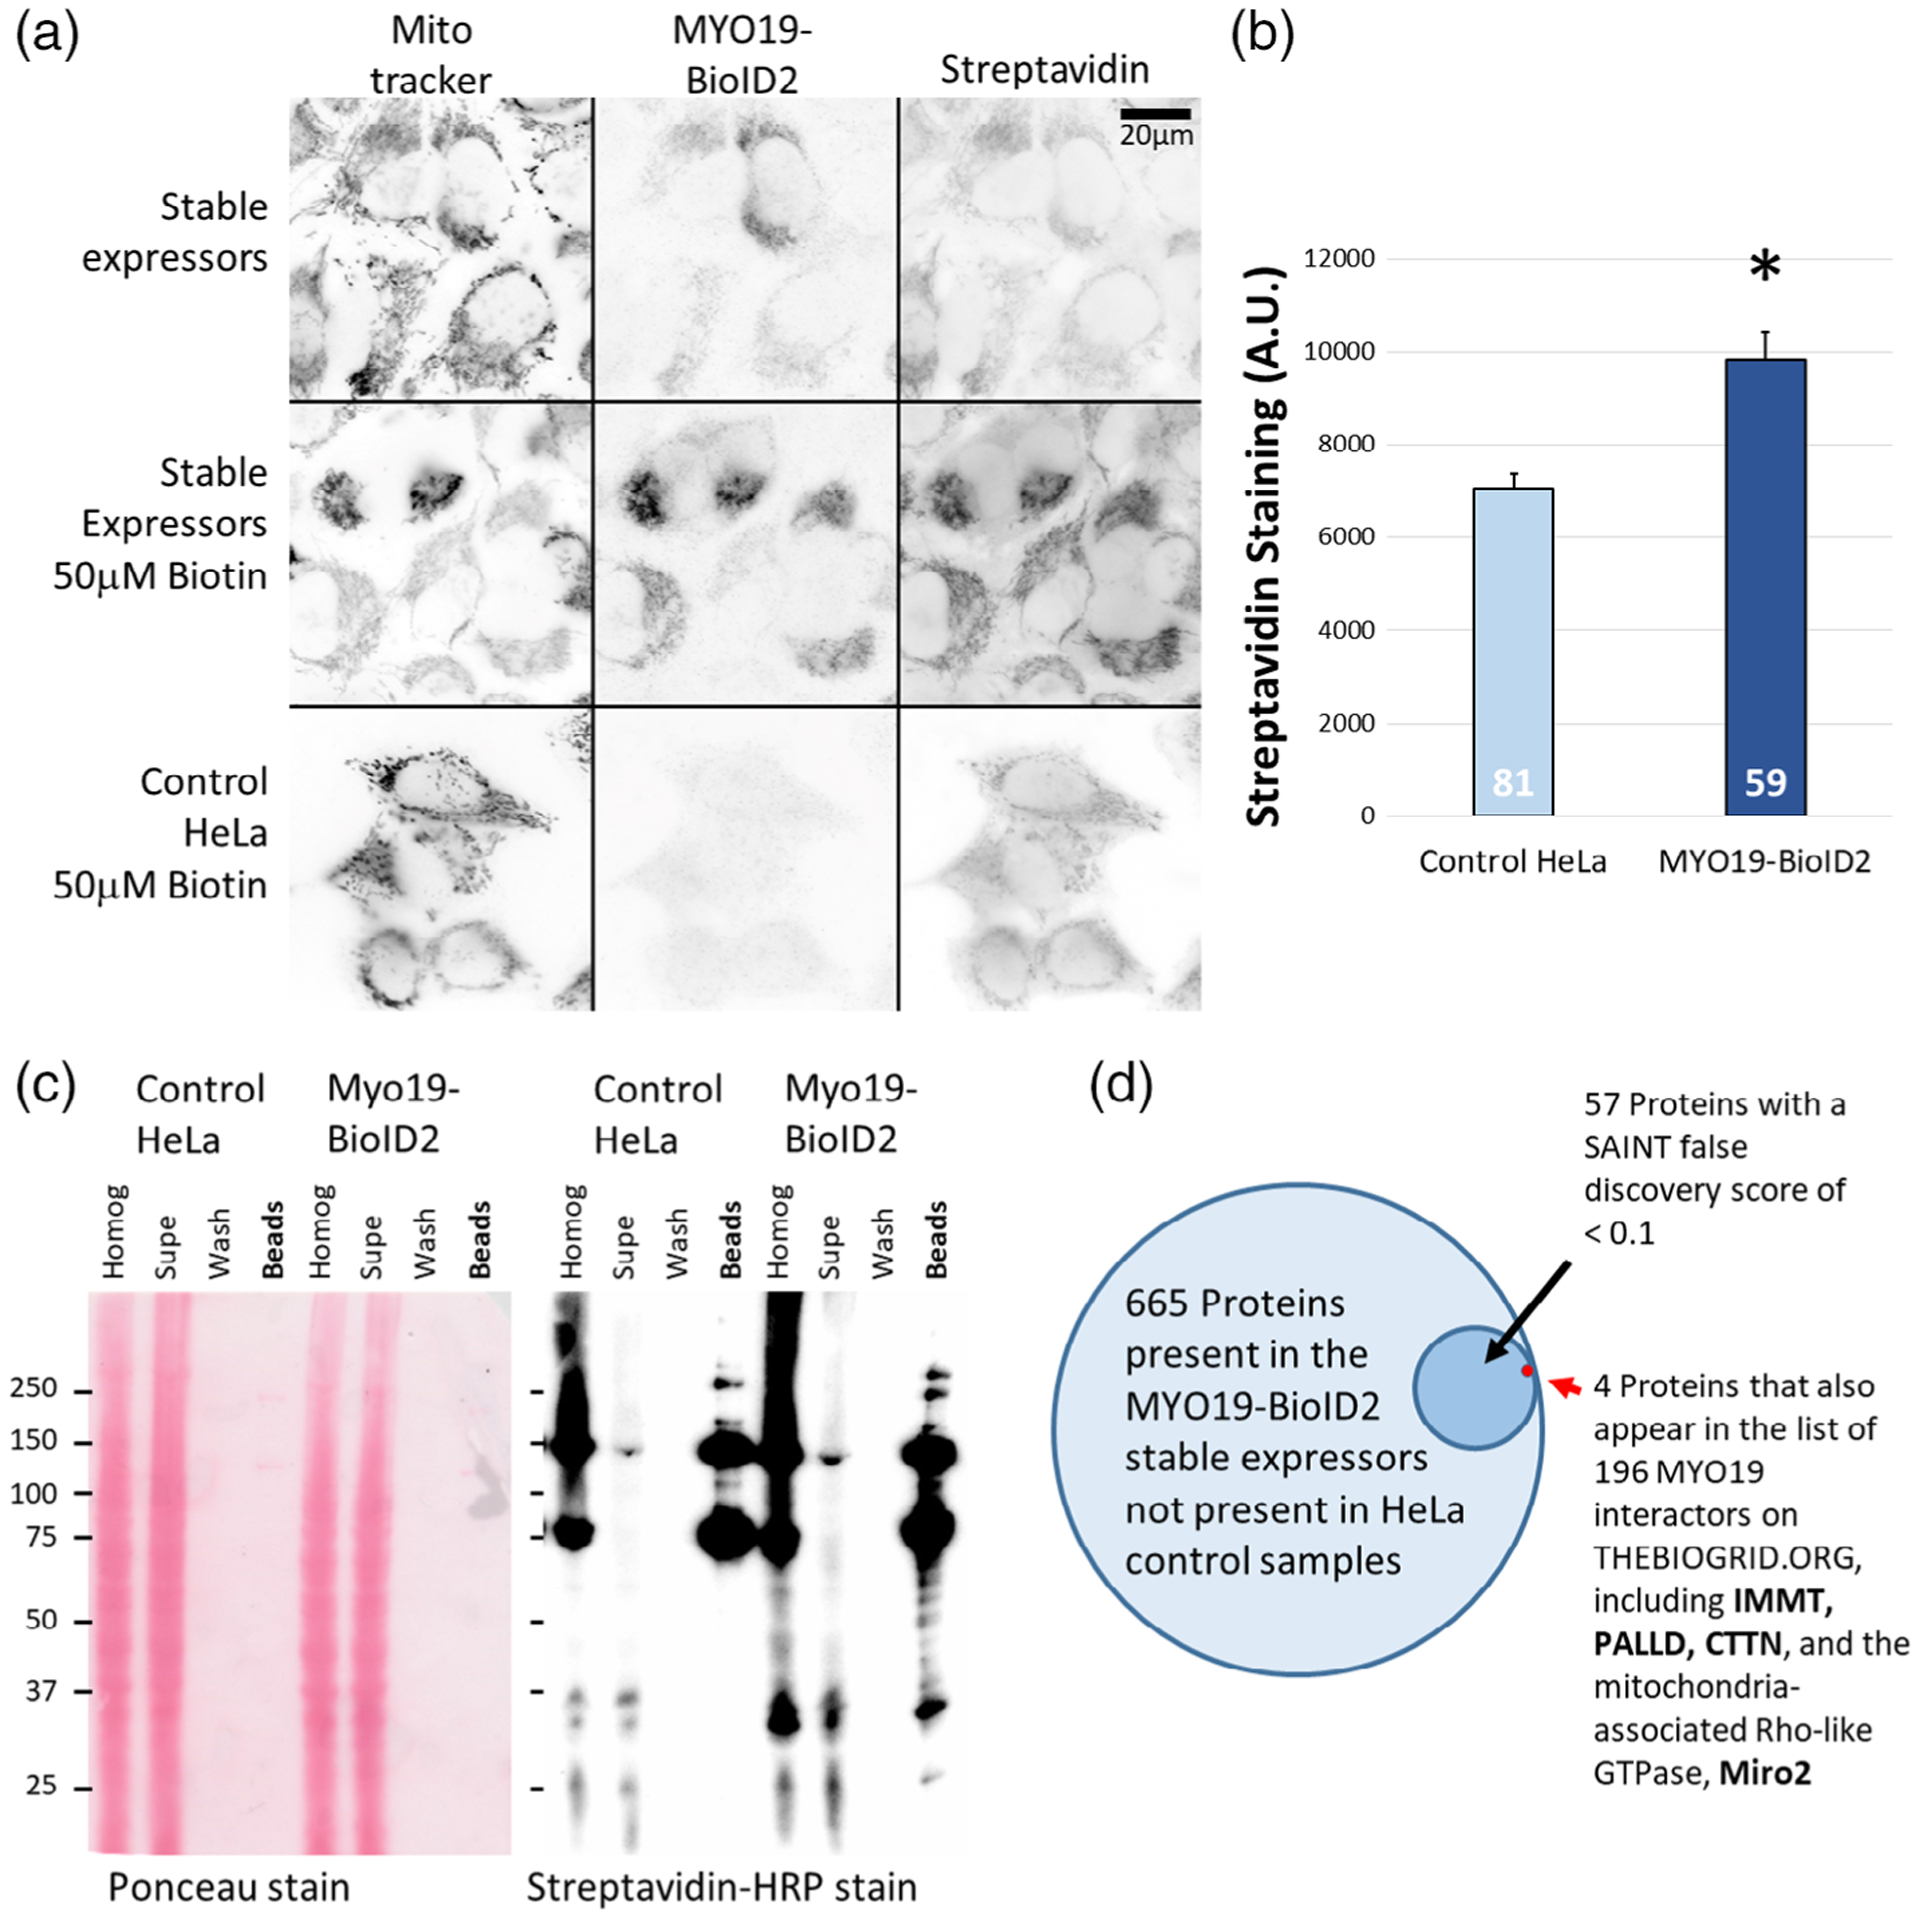
FIGURE 1.

Putative MYO19 interactors can be identified using proteomic approaches. (a) Cells stably expressing myc-MYO19824–970-BioID2 were generated via lentiviral infection, and showed biotinylation of mitochondrial proteins following overnight incubation with 50 μM biotin. Expression of MYO19824–970-BioID2 was visualized via α-myc immunostaining, and biotinylation via ALEXA350-streptavidin staining. Each fluorescence channel was acquired under the same settings and displayed using the same scaling. The scale bar represents 20 μm. (b) Quantification of ALEXA350-streptavidin staining indicates that MYO19824–970-BioID2 HeLa cells showed a ~40% increase in biotinylation of mitochondrial-enriched regions compared to control HeLa cells (p < 0.005, t-test). The number at the base of the bar is the number of cells (n) analyzed. (c) HRP-streptavidin blot demonstrating increased biotinylation in HeLa cells stably expressing MYO19824–970-BioID2. Ponceau staining (left) demonstrates that the samples were loaded for equal cell number, and streptavidin-HRP staining (right) of the affinity bead sample lane from the BioID2 expressing cells shows more bands and darker labeling. (d) Proteins from three sets of biotin-exposed cells stably expressing MYO19824–970-BioID2 were identified via mass spectroscopy. Of the 1,420 proteins identified across all samples (including biotin-exposed, control HeLa cells), 665 proteins were not observed in control samples. Fifty seven of those proteins had a SAINT false discovery rate <0.1. Of those proteins, four were cross-listed in BIOGRID data for MYO19 interactors previously identified by affinity-capture mass spectrometry
