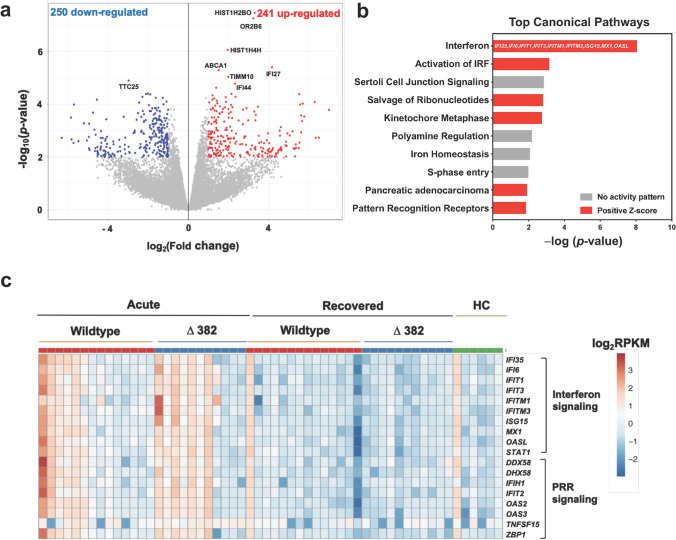
Fig. 1.
Whole blood transcriptome analysis in COVID-19 patients. RNA-seq of whole blood from COVID-19 patients (n = 25) at acute (SARS-CoV-2 PCR-positive, median 8 days PIO) and recovered (SARS-CoV-2 PCR-negative, median 21 days PIO) phases and healthy controls (n = 6) was performed. a Volcano plot indicating DEGs between blood samples collected at acute and recovered phases in patients with WT SARS-CoV-2 infection (n = 13), with thresholds of p-value < 0.01 and |FC|> 2. Numbers of over-expressed and under-expressed genes are indicated. b Top IPA canonical pathways showing differential expression of genes related to IFN and PRR signaling in WT SARS-CoV-2 infection. Pathways are ranked by − log(p-value), and the color scheme is based on predicted activation Z-scores, with activation in red and undetermined directionality in gray. DEGs related to the IFN pathway are indicated on the bar graph. c Heatmap of DEGs related to IFN and PRR signaling between COVID-19 patients infected with WT (n = 14) and Δ382 SARS-CoV-2 (n = 11) at acute and recovered phases and healthy controls. Heatmap is scaled based on log2RPKM values, with blue and red indicating low and high expressions, respectively. WT, wildtype; DEGs, differentially expressed genes; FC, fold change; FDR, false discovery rate; PCR, polymerase chain reaction; PIO, post-illness onset; HC, healthy controls; RPKM, reads per kilobase per million reads mapped; IFN, interferon; PRR, pattern recognition receptor

