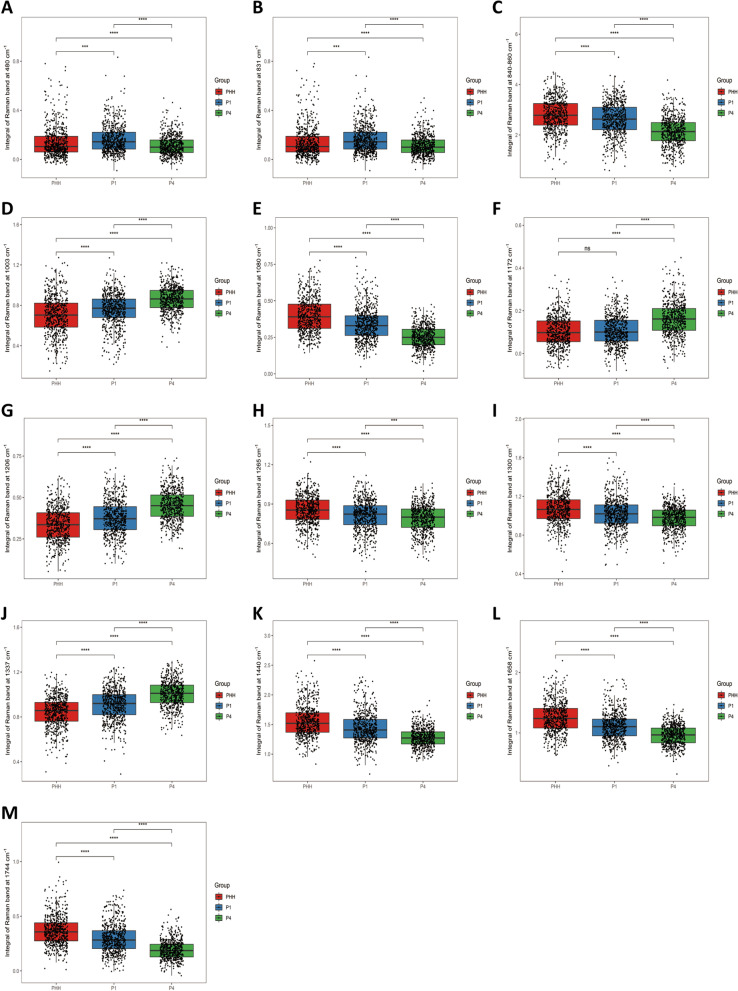
Fig. 4.
The peak area were semi-quantitative to compare differences of the specific Raman bands a 480 (glycogen), b 831 (tyrosine), c 840–860 (polysaccharide structure), d 1003 (phenylalanine), e 1080 (amide II, typical phospholipid), f 1172 (C–H in-plane bending mode of tyrosine), g 1206 (hydroxyproline, tyrosine), h 1265 (α-helix, collagen, tryptophan), i 1300 (lipids), j 1337 (amide III), k 1440 (lipids), l 1658 (amide I), m 1744 (carbonyl feature of lipid spectra) in PHH (Lot:005), ProliHHs P1 and P4. The results represent median, ns p 0.05, * p < 0.05, ** p < 0.01, *** p < 0.001, **** p < 0.0001 (PHH: primary human hepatocytes, ProliHHs: proliferating human hepatocytes, P1: passage 1, P4: passage 4)

