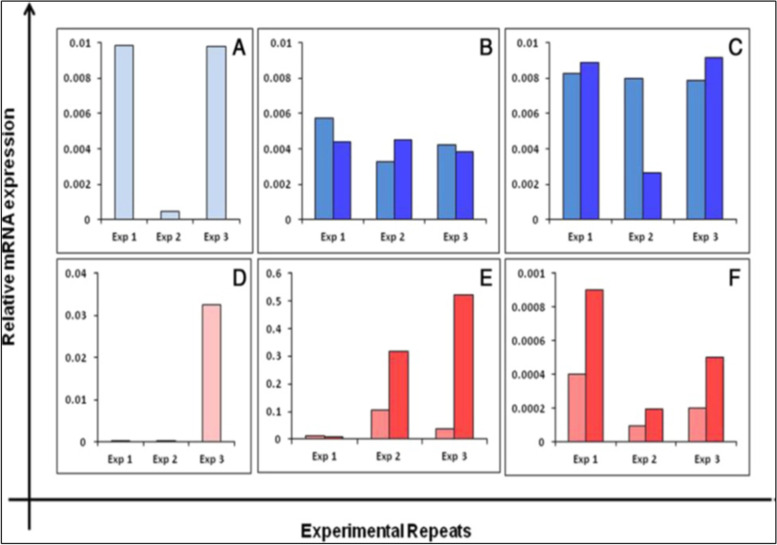
Fig. 6.
Differential expression of Fshr-1 (upper panel) and Fshr-3 (lower panel) transcripts in sheep OSE cells after treating with FSH. Fshr-1 transcripts (dark blue bars) in vitro after 0, 3 and 15 h or without (light blue bars) FSH treatment (A-C). Evidently Fshr-1 was not affected by FSH treatment. Whereas Fshr-3 after FSH (red bars) showed upregulation compared to without FSH (pink bars) treatment. Expression of Fshr-3 was maximal after 3 h (please note a change in Y-axis scale to appreciate a difference between (D-F). The relative expression levels of each transcript from three different experiments are represented individually [24]. These results of FSH action on normal sheep OSE cells via Fshr-3 in vitro are similar to those reported for tumorigenic cell line ID8 and discussed above in Table 1 [19]

