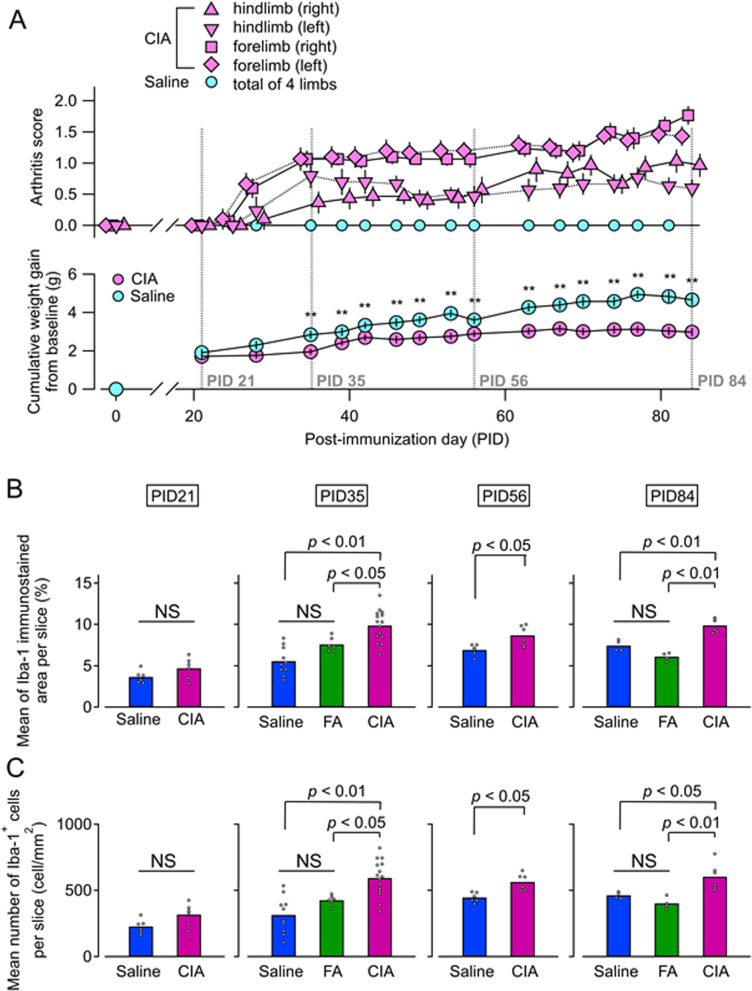
Fig. 2.
Arthritis scores, body weight changes, and Iba-1 immunoreactivity by disease phase. A Time course of arthritis scores (upper panel) and body weight changes (lower panel) (CIA, n = 30; saline, n = 24). Dashed line represents the day of brain analysis. No arthritic mice were found on PID 21. Arthritis scores gradually increased after onset. Joint swelling was sustained on PID 84. Cumulative weight gain from baseline (PID 0) in the CIA group were significantly lower compared with the saline group after PID 35 (**p < 0.01, by unpaired t-test). B Quantitative analysis of ionized Iba-1-immunostained area (%). C Quantitative analysis of numbers of Iba-1-positive cells. There were no significant differences between groups on PID 21 by unpaired t-test (CIA, n = 6; saline, n = 6). Conversely, area and number were significantly larger in the CIA group compared with the saline group on PID 35 (CIA, n = 15; FA, n = 6; saline, n = 10), PID 56 (CIA, n = 6; saline, n = 6), and PID 84 (CIA, n = 6; FA, n = 4; saline, n = 4) by unpaired t-test. Abbreviation: CIA, collagen-induced arthritis; FA, Freund’s adjuvant; Iba-1, ionized calcium-binding adaptor protein-1; NS, non-significant; PID, post-immunization day

