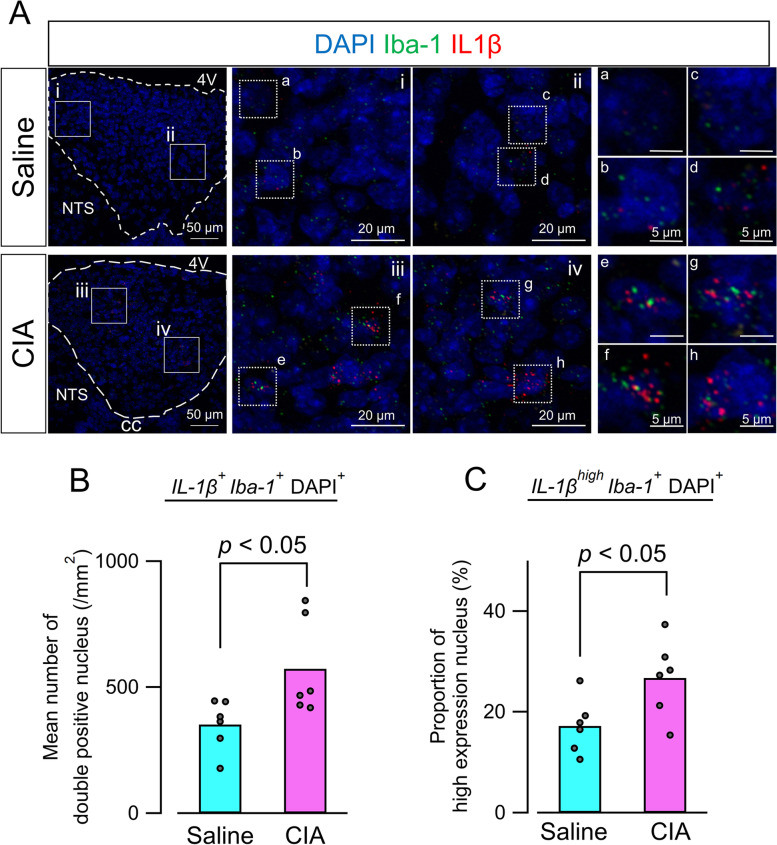
Fig. 5.
Microglial IL-1β mRNA expression in the AP. A Representative merged images of IL-1β (red) and Iba-1 (green) mRNA expression in the AP. Dashed lines indicate region of the AP (left panels). Magnified images of boxed areas in left panels are shown in middle panels (i–iv). High-magnification images of dashed boxed area in middle panels are shown in the right panels (a–h). In the CIA group, increased numbers of nuclei co-expressing IL-1β and Iba-1 were observed. Additionally, Iba-1-positive nuclei exhibiting high-density IL-1β mRNA expression were more frequently detected in the CIA group. B Quantitative analysis of the number of nuclei co-expressing IL-1β and Iba-1. Numbers of nuclei were significantly increased in the CIA group (n = 6) compared with the saline group (n = 6) by Mann–Whitney U test. C Quantitative analysis of proportions of Iba-1-positive nuclei with high-density IL-1β mRNA expression. Proportions were significantly increased in the CIA group (CIA, n = 6; saline, n = 6) by unpaired t-test. Abbreviations: AP, area postrema; CIA, collagen-induced arthritis; Iba-1, ionized calcium-binding adaptor protein-1; IL-1β interleukin-1β

