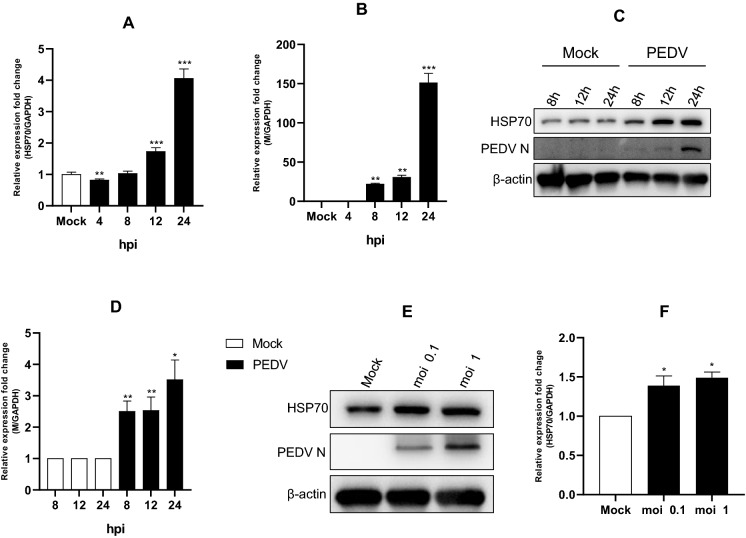
Figure 1.
Cellular HSP70 expression level in PEDV-infected cells. A–B Vero cells were infected with PEDV at an MOI of 1 and harvested at different times as indicated. Total RNA was isolated to analyse HSP70 and viral M gene mRNA levels by quantitative RT–PCR. The mRNA levels of HSP70 and viral M were normalized to the mRNA levels of GAPDH. C–D Cell extracts were analysed by Western blot using anti-HSP70, anti-PEDV, and anti-β-actin antibodies. β-actin served as an internal control. The protein levels of HSP70 and PEDV were quantified by determining band intensities and normalized to β-actin. E IPEC-J2 cells were infected with PEDV at an MOI of 0.1 or 1. Cells were harvested at 24 hpi. The cell extracts were analysed by Western blot using anti-HSP70, anti-PEDV, and anti-β-actin antibodies. β-actin served as an internal control. F The levels of HSP70 and PEDV protein in IPEC-J2 cells were quantified by determining band intensities, and subsequent normalization to the levels of data is the mean ± SD (n = 3, *p < 0.05, **p < 0.01, ***p < 0.001).

