
Figure 4.
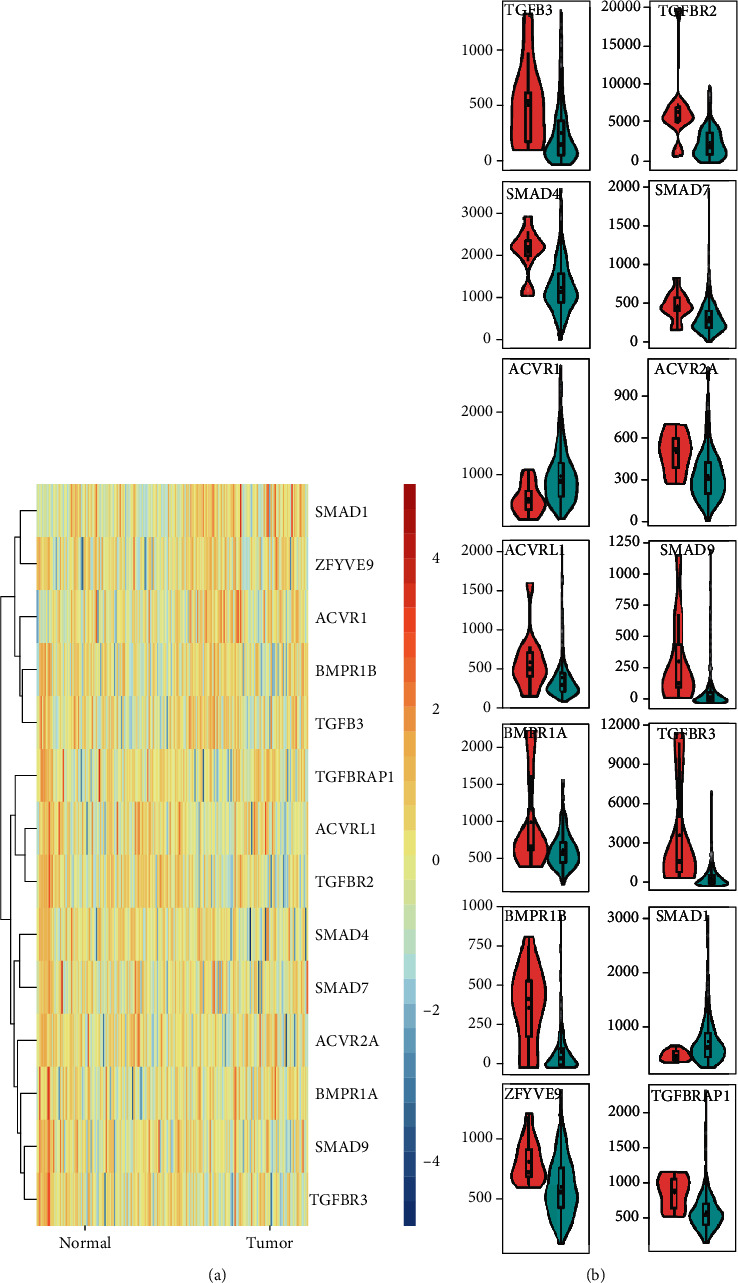
Relative transcriptional expression of TGF-β signaling regulators in EC patients. (a) Heatmap showed the comparison of the RNA levels of TGF-β signaling regulators in EC and noncancer samples. (b) ZFYVE9, BMPR1B, TGFB3, TGFBRAP1, ACVRL1, TGFBR2, SMAD4, SMAD7, ACVR2A, BMPR1A, SMAD9, and TGFBR3 were significantly downregulated in EC tumor samples compared to normal samples; however, ACVR1 and SMAD1 were upregulated in EC samples.