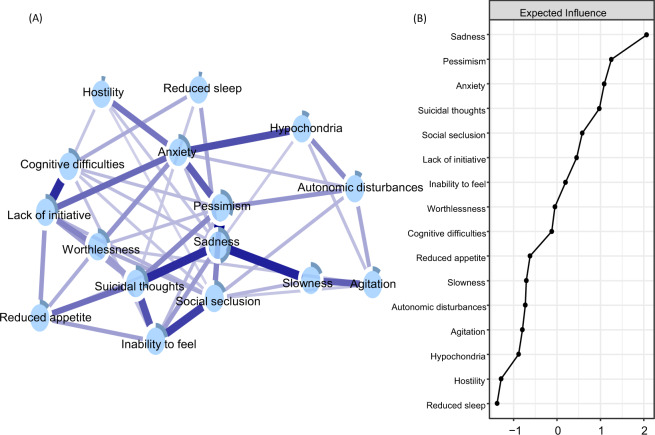
Fig. 1. Network of depressive symptoms (panel A) and centrality measure of expected influence (panel B).
Blue connections indicate positive correlations; the thickness of lines is proportional to the strength of the correlation. The darker outer circle of each node represents the predictability, i.e., the proportion of variance explained by its neighbouring nodes. Expected influence is the standardized sum of the weights of all direct connections between a specific symptom and all other symptoms.

