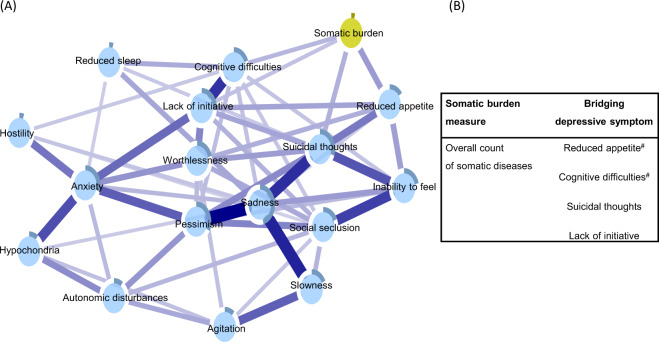
Fig. 4. Network of depressive symptoms with a node for overall somatic burden (panel A).
Blue connections indicate positive correlations; the thickness of lines is proportional to the strength of the correlation. The darker outer circle of each node represents the predictability, i.e., the proportion of the variance in a node explained by its neighbouring nodes. The table (panel B) reports bridge connections between the overall somatic burden and depressive symptoms. #Bridge connection preserved after including nodes for age, sex, and education.

