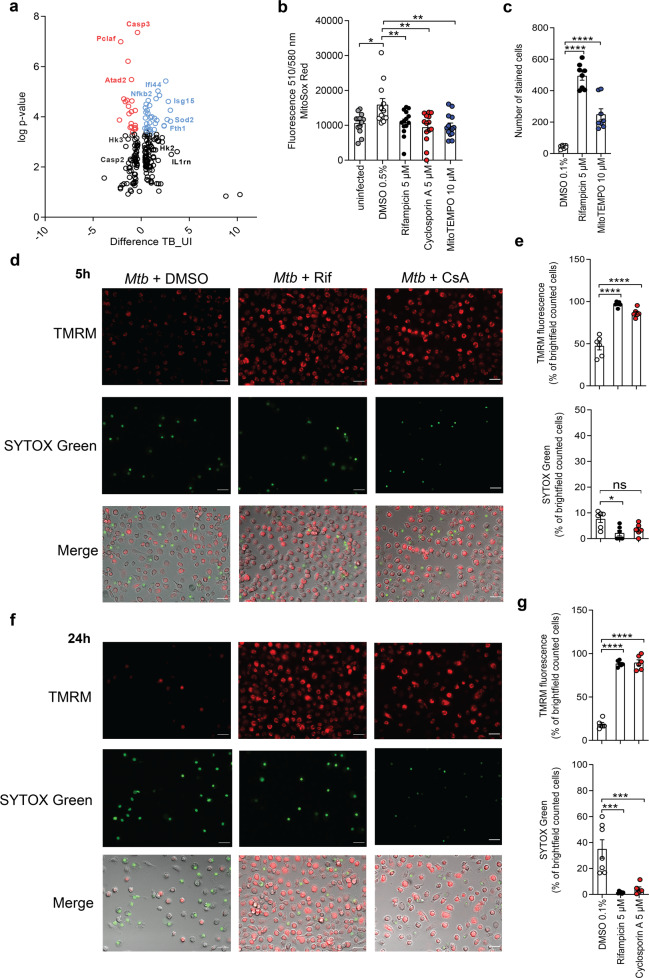
Fig. 1. Mtb induces mitochondrial damage.
a Proteome analysis by mass spectrometry of whole-cell lysates of uninfected and Mtb-infected J774.2 macrophages showing differentially regulated proteins (macrophage; n = 3; black dots = lower log p value and difference; red = upregulated genes; blue = downregulated genes). b Quantification of mitochondrial ROS in Mtb-infected MRC-5 lung fibroblasts (MOI 10) using MitoSOX Red 24 h post infection (n = 16). c Survival of primary human macrophages infected with Mtb (MOI 1) and treated with the superoxide scavenger MitoTEMPO (10 µM). Cells were stained with 4’,6-diamidino-2-phenylindole (DAPI) and the number of surviving cells was determined 48 h post infection (n = 8). Data from two experiments with multiple replicates are shown. Results are expressed as mean ± SEM. Analysis was done using one-way ANOVA and Bonferroni post-test (*p ≤ 0.05; **p ≤ 0.001; ****p ≤ 0.0001). d–g Fluorescence microscopy of primary human macrophages infected with Mtb (MOI 1) and treated with cyclosporin A (5 µM). Macrophages were stained with tetramethyl rhodamine (TMRM) and SYTOX Green d, e 5 h and f, g 24 h post infection. The number of stained cells was determined in relation to the number of brightfield (BF) counted cells (n = 6) (e, g). Representative images of Mtb-infected primary human macrophages stained with TMRM and SYTOX Green c 5 h and e 24 h post infection (scale bar: 100 μm). Data from two experiments with multiple replicates are shown. Results are expressed as mean ± SEM. Analysis was done using one-way ANOVA with Bonferroni post-test (ns, not significant; *p ≤ 0.05; **p ≤ 0.01; ***p ≤ 0.001; ****p ≤ 0.0001).

