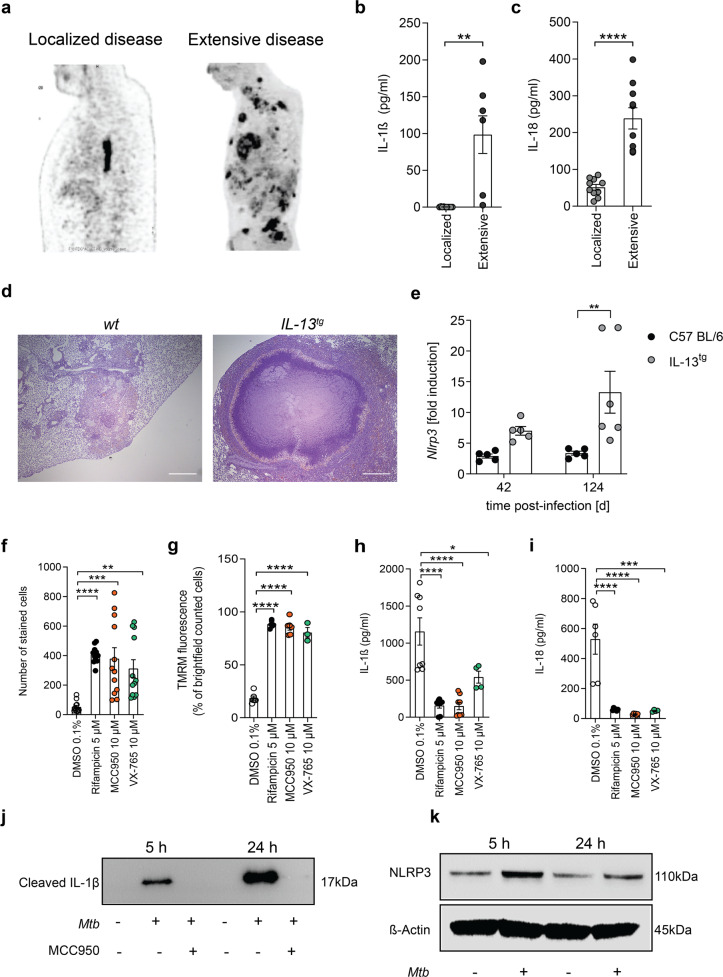
Fig. 3. Mtb-induced inflammasome activation occurs upstream and independently from mitochondrial damage.
a 18F-FDG PET demonstrating multiple FDG-avid tuberculous lesions in one patient (right side) and with a single PET-positive mediastinal lymph node in a patient on the left side. Lateral chest view. b Quantification of IL-1β concentration (pg/ml) in the plasma for TB patients with localized (n = 10) and extensive (n = 10) tuberculous lesions. c Quantification of IL-18 concentration (pg/ml) in the plasma for TB patients with localized (n = 10) and extensive (n = 10) tuberculous lesions. d Representative pictures of H&E-stained lungs explanted from wild-type (wt) and IL-13tg mice infected with Mtb (scale bar: 500 µM). e RT-q-PCR for detection for NLPR3 expression levels (fold induction) in Mtb-infected lungs from wt (black circle) and IL-13tg (gray circle) mice 42 and 124 days post infection. Each dot represents one mouse lung. f Survival of Mtb-infected primary human macrophages (MOI 1) treated with MCC950 or VX-765 48 h post infection (n = 12). g Quantification of TMRM stain of Mtb-infected primary human macrophages treated with MCC950 or VX-765 (n = 3). The number of stained cells was determined in relation to the number of brightfield (BF) counted cells (n = 6). Quantification of h IL-1β (n = 6) and i IL-18 (n = 8) concentration in the supernatant of Mtb-infected primary human macrophages. j Detection of cleaved IL-1β in the supernatant of Mtb-infected THP-1 by western blot analysis (n = 2). k Detection of NLRP3 in whole-cell lysates of uninfected and Mtb-infected primary human macrophages (n = 2). Results are expressed as mean ± SEM. Analysis was done using one-way ANOVA with Bonferroni post-test (ns, not significant; *p ≤ 0.05; **p ≤ 0.01; ***p ≤ 0.001; ****p ≤ 0.0001).

