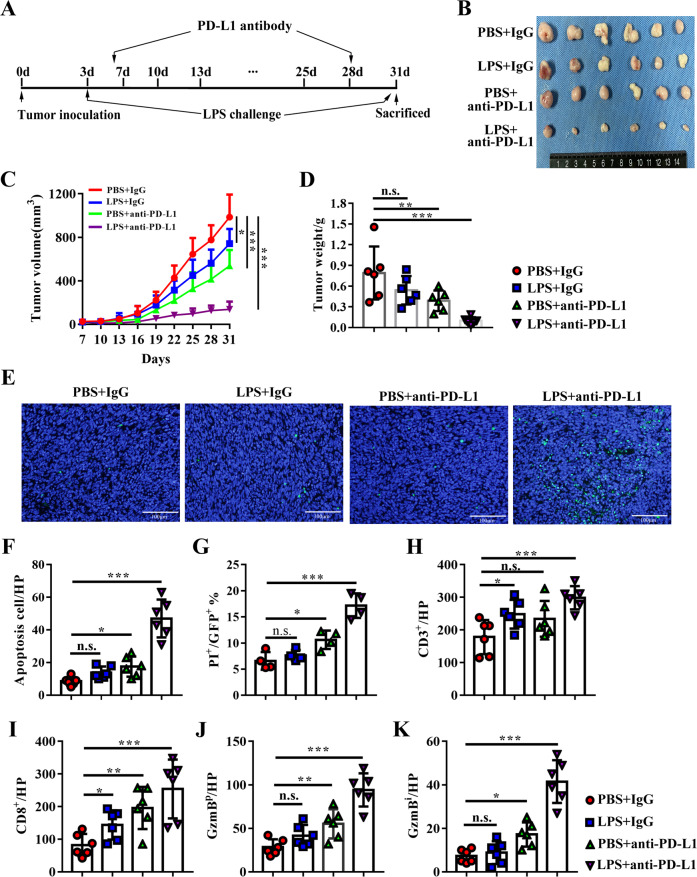
Fig. 6. LPS enhanced PD-L1 blocking therapy in PDAC murine model by promoting anti-tumor immune.
A the process of LPS and anti-PD-L1 therapy animal experiment. B subcutaneous tumor derived from PBS + IgG isotype group, LPS + IgG isotype group, PBS + anti-PD-L1 group, and LPS + anti-PD-L1 group at the end of the experiments (n = 6). Tumor growth curve (C) and tumor volume (D) of tumor derived from each group. E representative image of tunnel staining in each group to evaluate apoptotic cells. F apoptosis cell was calculated as tunnel+ cells/ visual filed. G apoptotic cancer cells in each group was evaluated by calculating the percentage of PI-positive cells in all GFP-positive cells (n = 4). Tumor infiltrated CD3+ (H) and CD8+ (I) T cells were stained by immunochemistry and analyzed as positive staining number per high visual field (HP). Peritumoral GzmB (J) and intratumoral GzmB (K) distribution were calculated as GzmBp/percentage of the peritumoral area or GzmBi/percentage of peritumoral area in a visual field, separately. *, **, *** and n.s. means statistically significant difference at p < 0.05, p < 0.01, p < 0.001 and no significant, respectively.

