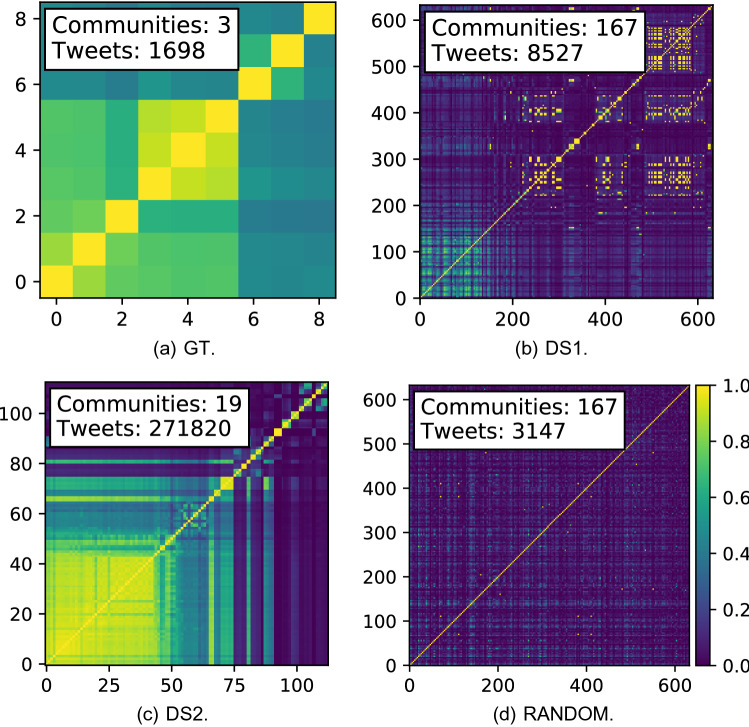
Fig. 6.
Similarity matrices of content posted by HCC accounts (FSA_V, ). Each axis has an entry for each account, grouped by HCC. Each cell represents the similarity between the two corresponding accounts’ content, calculated using cosine similarity (yellow = high similarity). Each account’s content is modeled as a vector of 5 character n-grams of their combined tweets

