
Fig. 2 |. Nonlinear dynamics.
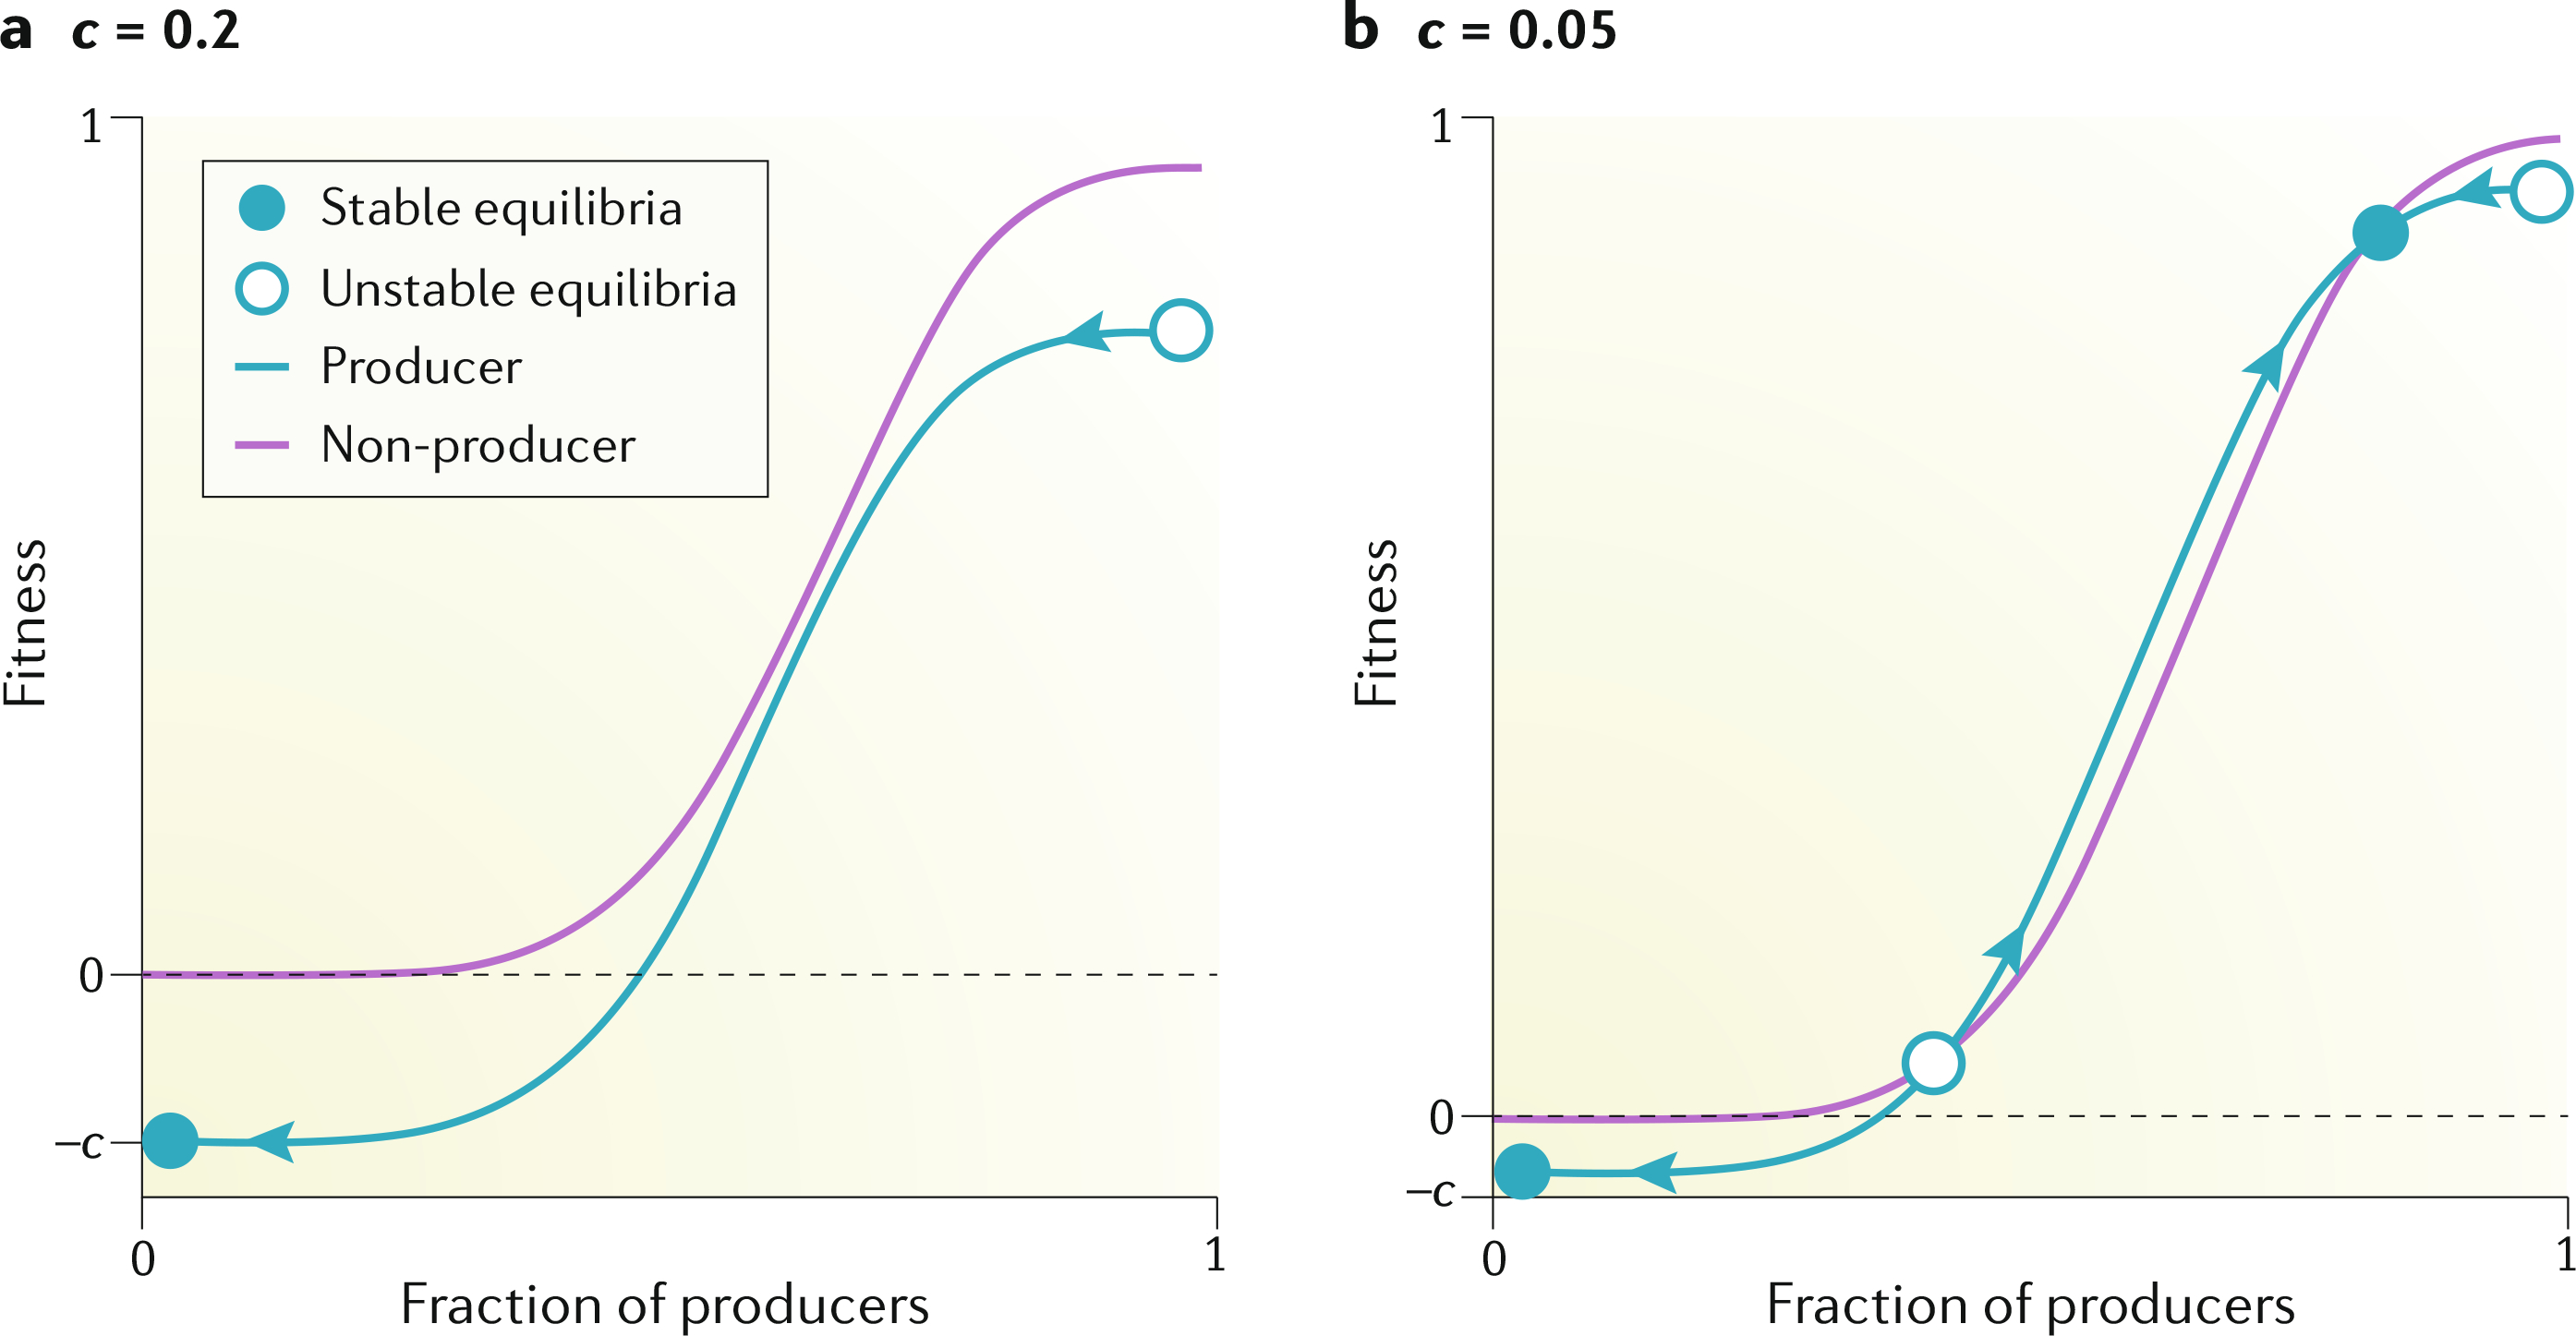
The fitness values of producer and non-producer cells as a function of the fraction of producer cells for different costs of growth factor production c are shown. Equilibria and the direction of the dynamics (arrows) are shown. a | When the cost–benefit ratio of growth factor production (c) is high (c = 0.2), non-producer cells have a fitness advantage for any fraction of the two types, and hence, their frequency increases over time until the producers are eliminated from the population. b | When the cost is low enough (c = 0.05), however, the small advantage of having an extra producer (itself) in the group can be enough to confer a net fitness advantage to producers when they are at intermediate frequencies within the population; in this case, the population can converge to a mixed equilibrium of the two cell types.