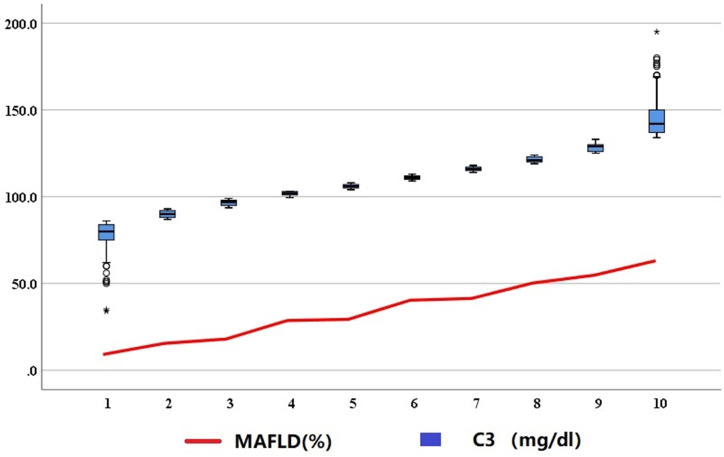
Figure 1.
The presence of MAFLD in the decile subgroups of complement C3 levels. Numbers from 1 to 10 represent the decile grouping of complement C3 (from 1st to 10th). MAFLD, metabolic-associated fatty liver disease. * at 1st decile represent the lowest C3 level and * at 10th decile represent the highest C3 level.

