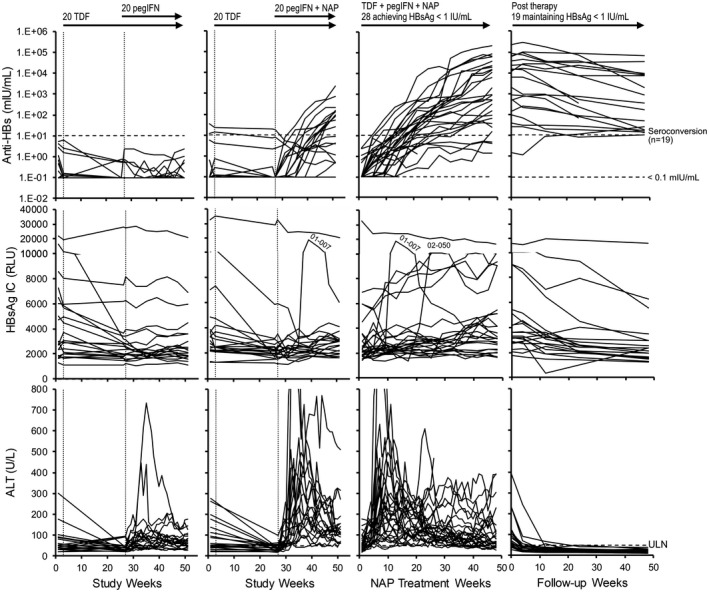
FIG. 4.

Analysis of HBsAg IC dynamics in the REP 401 study. Anti‐HBs (top row) and ALT dynamics (bottom row) are provided for comparison with HBsAg IC dynamics (middle row). Individual responses for all control (left) and experimental (middle left) participants during the first 48 weeks of treatment, for all participants achieving HBsAg < 1 IU/mL during 48 weeks of NAP therapy (middle right) and maintaining HBsAg < 1 IU/mL after removal of all therapy (right) are provided. Participants with HBsAg IC “flares” (01‐007 and 02‐050) are identified (see also insets). Participants with continuous increases in HBsAg IC during therapy and follow‐up (n = 4) are identified in bold (top, middle) and in inset (*, bottom). Treatment paradigms are indicated at the top (see also Fig. 2A). Anti‐HBs and ALT data were previously published.( 19 ) Anti‐HBs and HBsAg IC responses in all participants experiencing viral rebound during follow‐up are presented in Supporting Fig. S2.
