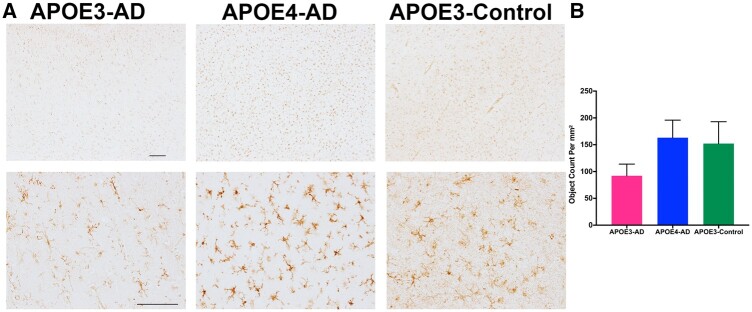
FIGURE 4.
Association between APOE isoforms and microglial morphology. (A) Immunohistochemistry staining of P2RY12 was scanned on the Axio Slide scanner and representative images from the regions were selected from Halo. Top row is 4× with a scale bar of 200 mM and bottom row is 20× with a scale bar of 100 mM. (B) Halo analysis was used to determine the quantification of microglia stained with P2RY12 using object analysis. PRISM 8 was used to generate graphical representation of data measuring object count per mm2.

