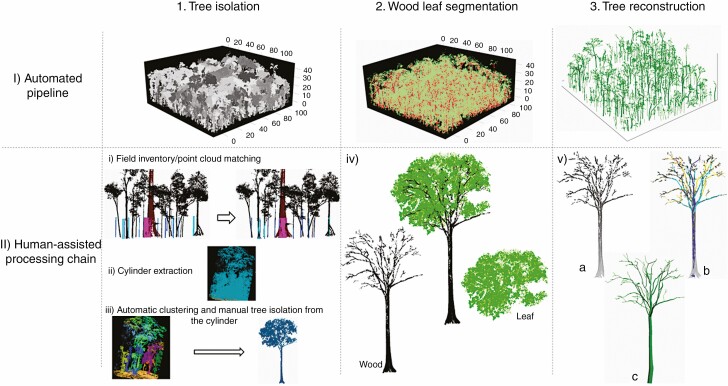
Fig. 2.
Summary scheme representing the automated and human-assisted processing pipelines. The three columns represent the main steps of the pipelines: (1) tree isolation; (2) wood/leaf segmentation; and (3) tree reconstruction. The two rows represent (I) an automated pipeline and (II) the fully human-assisted pipeline. The tree isolation step in the human-assisted processing chain (II-1) is split into three steps (i, ii and iii).

