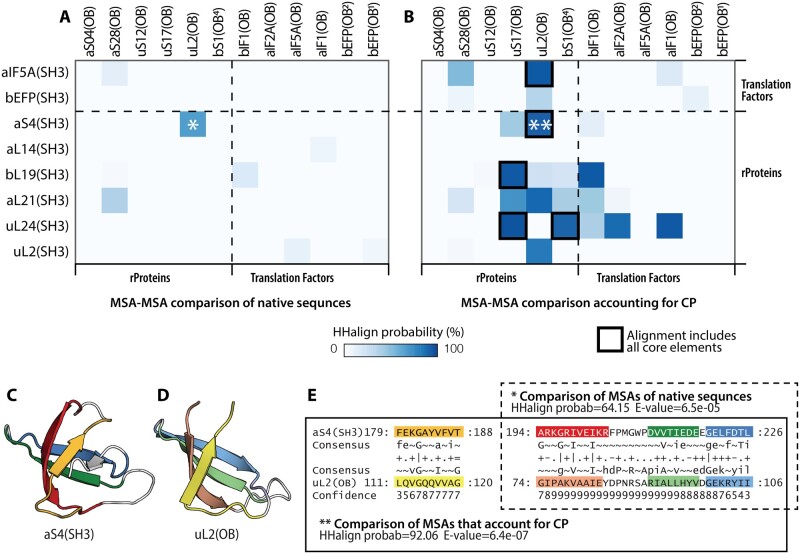
Fig. 3.
Comparisons of alignments of native sequence and circularly permuted SH3 and OB domains. Heatmap plots showing the HHalign probability values of profile–profile comparisons of the common core of (A) MSAs in native sequences, and (B) MSAs after correction for circular permutation. Ribbon representation of (C) aS4(SH3), and (D) uL2(OB). (E) Comparison of MSAs of aS4(SH3) and uL2(OB) in the native sequence (*) and after correction for circular permutation (**). The colors in panels (C), (D), and (E) are the same as in figure 1. CP, circular permutation.

