Fig. 4.
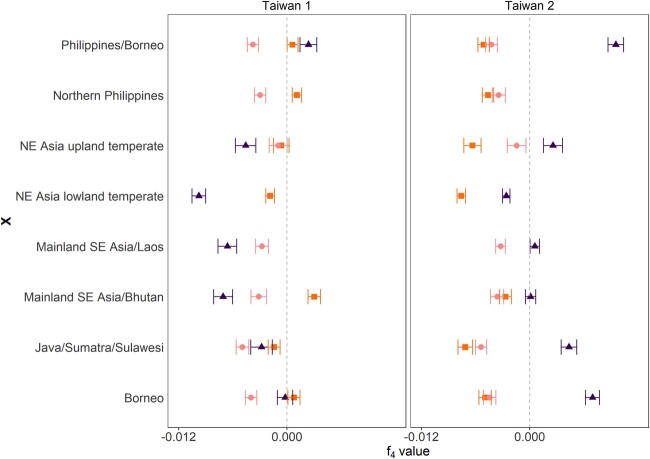
f4 statistics to detect relative degrees of gene flow. The f4 statistics is calculated between each Taiwanese subpopulation and the putative admixing sources mainland SE Asia/Laos, NE Asia lowland temperate, and Northern Philippine subpopulations. The f4 statistic were calculated for the model (OUT, mainland SE Asia; Taiwan, X) in squares, (OUT, NE Asia lowland temperate; Taiwan, X) in circles, and (OUT, Northern Philippines; Taiwan, X) in triangles, with OUT being Oryza barthii and X the subpopulations in the rows. The error around the mean (± standard error) of the f4 statistics are indicated. The dashed line denotes f4 = 0.

