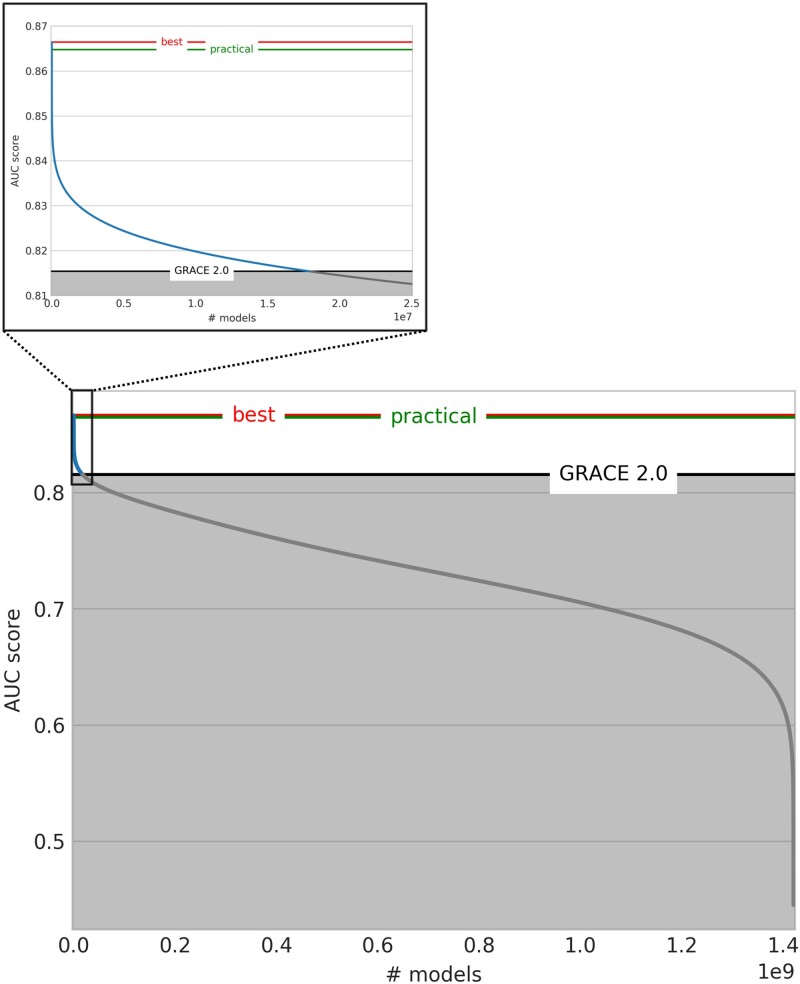
Figure 1.
AUCs of models predicting all-cause death at 1 year – numerous candidate risk scores improve risk prediction above GRACE 2.0. This figure shows model performance in terms of the five-fold cross-validated AUC score. A total of 1’420’494’075 models were obtained by combining the 56 baseline variables in all possible 8-variable models. The GRACE 2.0 Score performance is marked in black (AUC 0.815), the overall best and the overall best practical models’ performances are highlighted in red (AUC 0.866) and green (AUC 0.865) respectively. 17’857’817 (1.3%) models perform better than the GRACE 2.0 Score (blue curve segment on the left) (214’256’356 (15.1%) better than the GRACE 1.0 Score).

