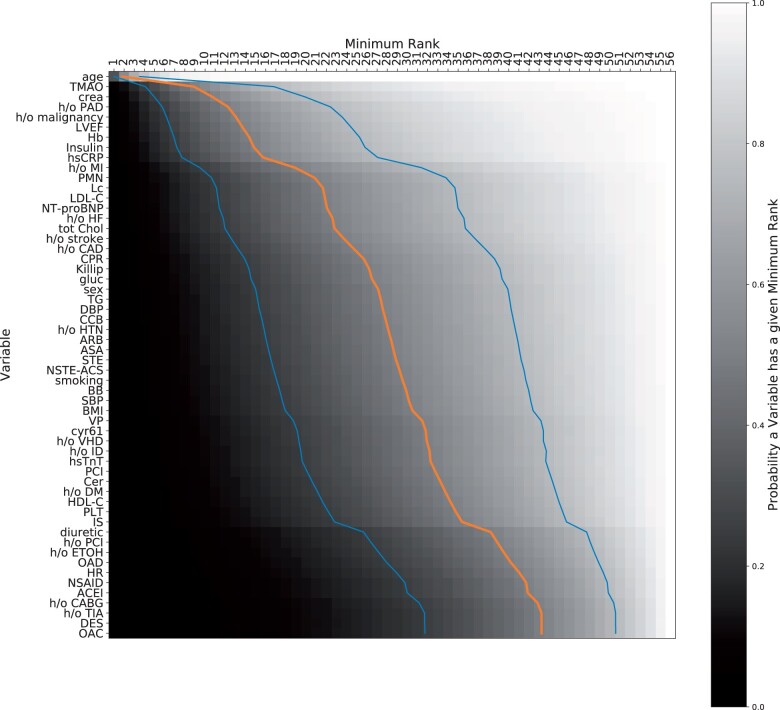
Figure 3.
Ranking of features according to their importance across all multivariate models shows the role of age, atherosclerosis burden, heart damage, inflammation, and novel biomarkers for 1-year all-cause mortality risk stratification. The variables on the left are ranked and each entry indicates whether the variable on the left has a certain minimum rank (column) with a certain probability (colour coding), e.g. age appears on rank 4 or better with probability close to 1, while OAC has only a minimum rank of 43 with probability 50%. The blue/orange/blue lines indicate the minimum rank that a variable achieves with probability 25%/50%/75%.

