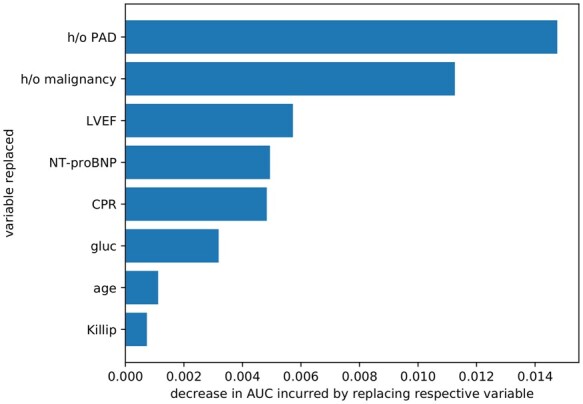
Figure 4.

Variable contribution to the performance of the SPUM-ACS Score. The SPUM-ACS Score model achieves AUC 0.86 while GRACE 2.0 achieves 0.81 (GRACE 1.0 achieves 0.78); the bars indicate how much the performance drops if the respective variable is being replaced by the next best practical variable, e.g. the model where we replace the LVEF variable is 0.006 AUC worse than the original model, while replacing Killip class in the SPUM-ACS model incurs a lesser drop in model performance, hence LVEF plays a more important role for this model.
