
Figure 5.
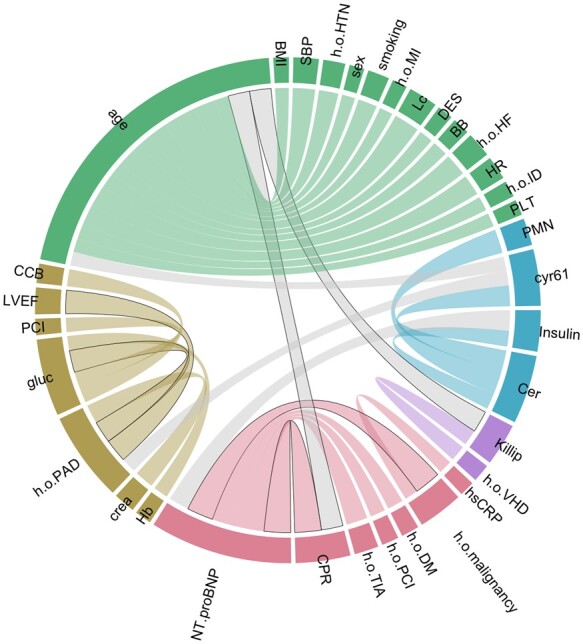
Pairwise correlations of variable occurrence in models outperforming GRACE 2.0. This scheme illustrates the degree to which variables complement each other in good models: Each node in the network corresponds to one variable. Its colour indicates a cluster membership. Clusters mark variables that are better combinable than expected based on both their ranks. Gray links mark good combinations of variables in different clusters, while coloured links highlight good inter-cluster combinations. The thicker a line, the higher is the correlation to appear together in good models. We only visualize the biggest 5% of positive correlations. Links that are realized in our score are highlighted with black borders. The two strongest correlations between CPR—NT-proBNP and h/o malignancy—NT-proBNP are among them.