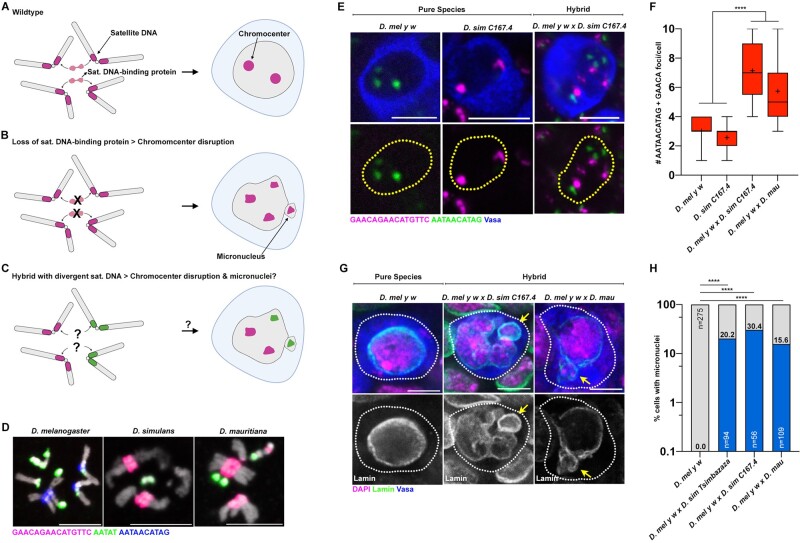
Fig. 1.
Chromocenter disruption and micronuclei in the larval germ cells of D. melanogaster–D. simulans/D. mauritiana hybrids. (A–C) A model of chromocenter formation (A) and function (B) in pure species and proposed dysfunction (C) in hybrids. (D) FISH against the (AATAACATAG)n satellite (blue), the (AATAT)n satellite (green), and the (GAACAGAACATGTTC)n satellite (magenta) on larval neuroblast mitotic chromosomes from the indicated species and costained with DAPI (gray). (E) FISH against the (AATAACATAG)n satellite (green) and the (GAACAGAACATGTTC)n satellite (magenta) in the larval female germ cells from the indicated species and hybrids and costained with Vasa (blue). (F) Box-and-whisker plot of the total number of (AATAACATAG)n and (GAACAGAACATGTTC)n chromocenter foci per larval germ cell from D. mel y w females (n = 38), D. sim C167.4 females (n = 28), D. mel y w×C167.4 hybrid females (n = 21), and D. mel y w×mau hybrid females (n = 42). n indicates the number of germ cells analyzed, **** represents P < 0.0001 based on Tukey’s multiple comparisons test from an ordinary one-way ANOVA and crosshairs mark the mean. (G) IF against Lamin (green) and Vasa (blue) in the larval female germ cells from the indicated species and hybrids and costained with DAPI (magenta). Arrows indicate micronuclei. (H) Quantification of micronuclei-containing cells in the larval female germ cells from the indicated species and hybrids. The percentage of micronuclei-containing cells is indicated above the respective columns. n indicates the number of germ cells analyzed, **** represents P < 0.0001 from Fisher’s exact test. All scale bars are 5 µm, yellow dashed lines demarcate nuclear boundary, and white dashed lines indicate cell boundary.

