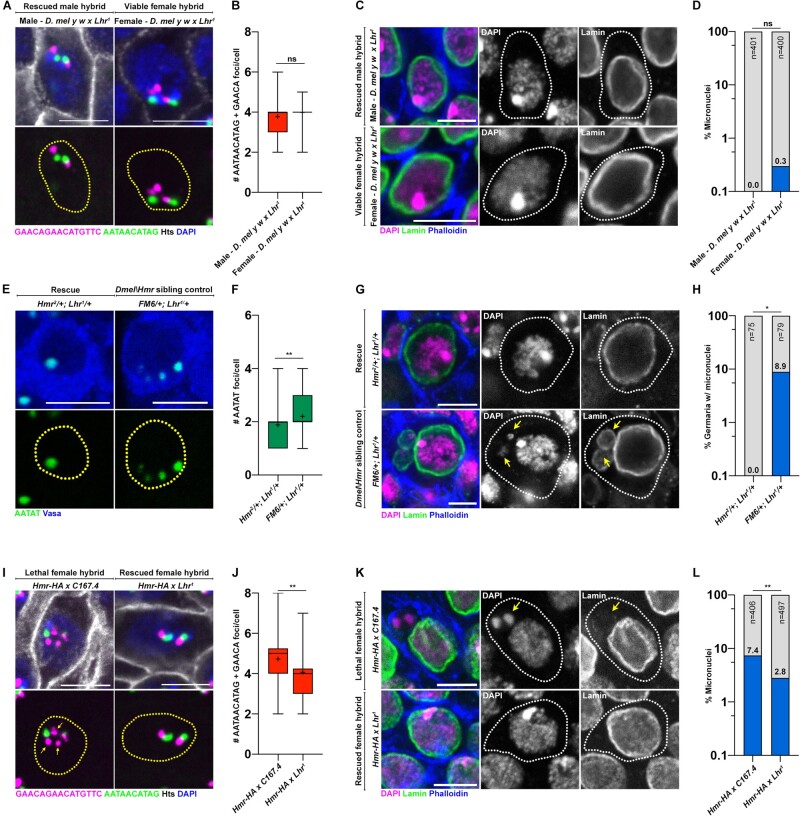
Fig. 3.
HI factors regulate chromocenter disruption and micronuclei in sterile and lethal hybrids. (A) FISH against the (AATAACATAG)n satellite (green) and the (GAACAGAACATGTTC)n satellite (magenta) on larval imaginal discs from the indicated hybrids and costained with DAPI (blue) and Hts (gray). (B) Box-and-whisker plot of total number of (AATAACATAG)n and (GAACAGAACATGTTC)n foci per cell from male (n = 63) and female (n = 63) D. mel y w×Lhr1 hybrids. n indicates the number of imaginal disc cells analyzed, ns represents P = 0.16 from a Student’s t-test and crosshairs mark the mean. (C) IF against Lamin (green) in larval imaginal discs from the indicated hybrids and costained with DAPI (magenta) and phalloidin (blue). (D) Quantification of micronuclei-containing cells in the larval imaginal discs from male and female D. mel y w×Lhr1 hybrids. The percentage of micronuclei-containing cells is indicated above the respective columns. n indicates the number of imaginal disc cells analyzed, ns represents P > 0.9999 from Fisher’s exact test. (E) FISH against the (AATAT)n satellite (green) in the early germ cells of the indicated 0- to 2-day-old adult female hybrids. (F) Box-and-whisker plot of total number of (AATAT)n foci per cell from In(1)AB, Hmr2/+; Lhr1/+ (n = 76) and FM6/+; Lhr1/+ germ cells (n = 73). n indicates the number of germ cells analyzed, ** represents P = 0.0074 from a Student’s t-test and crosshairs mark the mean. (G) IF against Lamin (green) in early germ cells from the indicated adult 0- to 2-day-old female hybrids and costained with DAPI (magenta) and phalloidin (blue). Arrows point to micronuclei. (H) Quantification of micronuclei-containing cells in the early germ cells from the indicated adult 0- to 2-day-old female hybrids. The percentage of micronuclei-containing cells is indicated above the respective columns. n indicates the number of germ cells analyzed, * represents P = 0.013 from Fisher’s exact test. (I) FISH against the (AATAACATAG)n satellite (green) and the (GAACAGAACATGTTC)n satellite (magenta) on larval imaginal discs from the indicated hybrids and costained with DAPI (blue) and Hts (gray). Arrows point to declustered satellite DNA. (J) Box-and-whisker plot of total number of (AATAACATAG)n and (GAACAGAACATGTTC)n foci per cell from Hmr-HA×C167.4 (n = 58) and Hmr-HA×Lhr1 (n = 62) female hybrids raised at 29 °C. n indicates the number of imaginal disc cells analyzed, ** represents P = 0.0022 from a Student’s t-test and crosshairs mark the mean. (K) IF against Lamin (green) in larval imaginal discs from the indicated female hybrids raised at 29 °C and costained with DAPI (magenta) and phalloidin (blue). Arrows point to micronuclei. (L) Quantification of micronuclei-containing cells in larval imaginal discs from the indicated female hybrids. The percentage of micronuclei-containing cells is indicated above the respective columns. n indicates the number of imaginal disc cells analyzed, ** represents P = 0.0017 from Fisher’s exact test. All scale bars are 5 µm, yellow dashed lines demarcate nuclear boundary, and white dashed lines indicate cell boundary.

