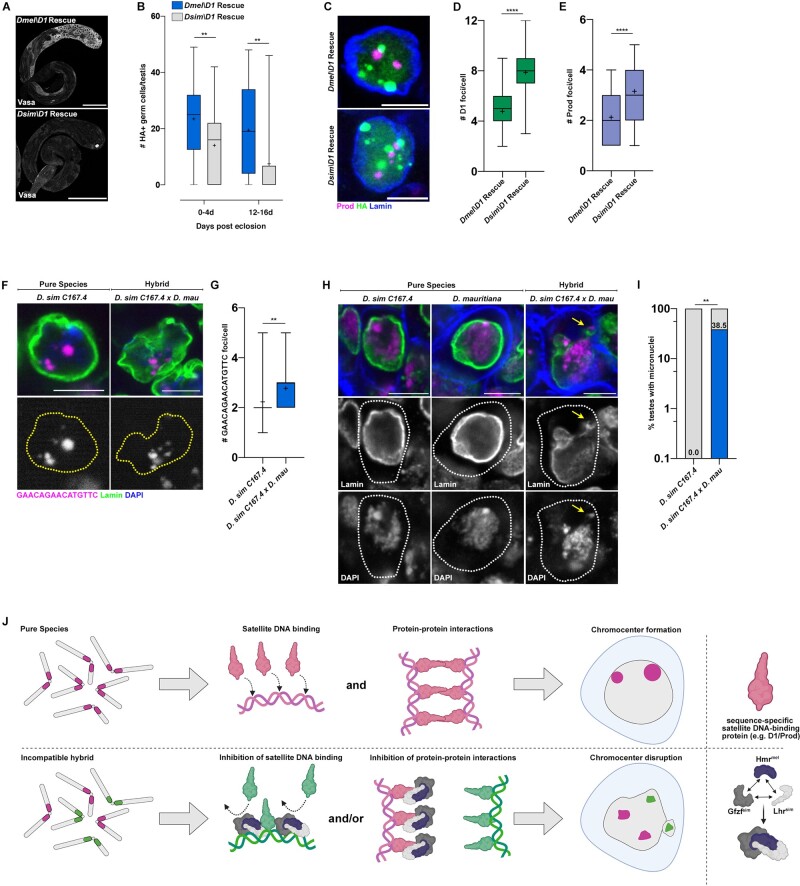
Fig. 4.
Functional divergence of the D1 chromocenter forming protein from D. melanogaster and D. simulans. (A) D1 mutant (D1LL03310) testes expressing HA-tagged UASt-D1mel and UASt-D1sim under the control of nos-gal4 were stained for Vasa (gray). Scale bars are 25 µm. (B) Quantification of HA+ germ cells in testes from 0- to 4-day-old and 12- to 16-day-old males of the following genotypes, nos>D1mel; D1LL03310 (n = 29, 0–4 days) and (n = 31, 12–16 days) and nos>D1sim; D1LL03310 (n = 31, 0–4 days) and (n = 32, 12–16 days). n indicates the number of testes analyzed, ** represents P = 0.006 (0–4 days) and P = 0.001 (12–16 days) from a Student’s t-test. (C) IF against Prod (magenta), HA (green), and Lamin (blue) in spermatogonial cells of the indicated genotypes. (D) Box-and-whisker plot of HA foci/cell in D1 mutant (D1LL03310) spermatogonia expressing D1mel-HA (n = 57) or D1sim-HA (n = 60). n indicates the number of germ cells analyzed, **** represents P < 0.0001 from Student’s t-test and crosshairs mark the mean. (E) Box-and-whisker plot of Prod foci/cell in D1 mutant (D1LL03310) spermatogonia expressing D1mel-HA (n = 57) or D1sim-HA (n = 60). n indicates the number of germ cells analyzed, **** represents P < 0.0001 from Student’s t-test and crosshairs mark the mean. (F) FISH against the (GAACAGAACATGTTC)n satellite (magenta) in spermatogonial cells from the indicated 0- to 3-day-old males and costained with DAPI (blue) and Lamin (green). (G) Box-and-whisker plot of large autosomal (GAACAGAACATGTTC)n foci per spermatogonial cell from D. sim C167.4 (n = 39) and D. sim C167.4×D. mau w+ (n = 31). n indicates the number of germ cells analyzed, ** represents P = 0.0067 from a Student’s t-test and crosshairs mark the mean. (H) IF against Lamin (green) in spermatogonial cells from the indicated 0- to 3-day-old males and costained with DAPI (magenta) and phalloidin (blue). Arrows point to micronuclei. (I) Quantification of testes containing at least one cell with a micronucleus from 0- to 4-day-old D. sim C167.4 pure species males (n = 18) and 0- to 4-day-old D. sim C167.4×D. mau hybrid males (n = 26). The percentage of micronuclei-containing testes is indicated above the respective columns. n indicates the number of testes analyzed, ** represents P = 0.0027 from Fisher’s exact test. All scale bars (except panel A) are 5 µm and yellow dashed lines demarcate nuclear boundary. (J) A speculative model of how hybrid incompatibility factors may inhibit chromocenter formation by species-specific satellite DNA-binding proteins in cells of affected hybrid tissues.

