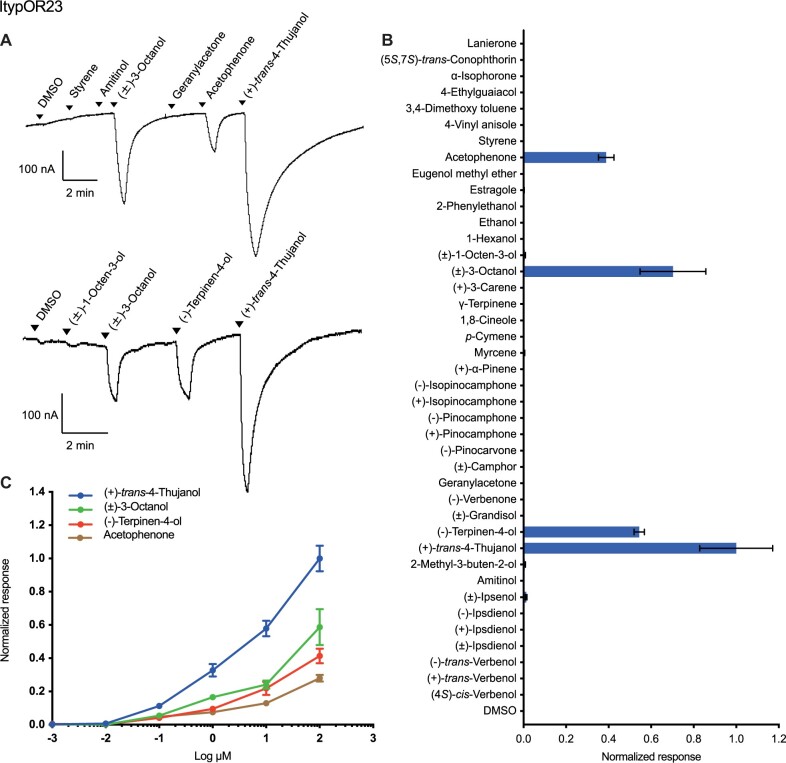
Fig. 2.
Responses of ItypOR23 in oocytes. (A) Representative current traces of oocytes upon successive exposures to 100 μM stimuli. Each compound was applied at the time indicated by the arrowheads for 20 s. Upper and lower traces include different sets of test stimuli. (B) Response profile of ItypOR23 to the full odor panel. Values were normalized based on the average response to the primary ligand of ItypOR23 (n ≥ 4). (C) Dose-dependent responses of oocytes expressing ItypOR23 to active ligands. Values were normalized based on the average response of ItypOR23 to the most active compound at 100 μM (n ≥ 4 for each ligand). Error bars indicate the SE.

