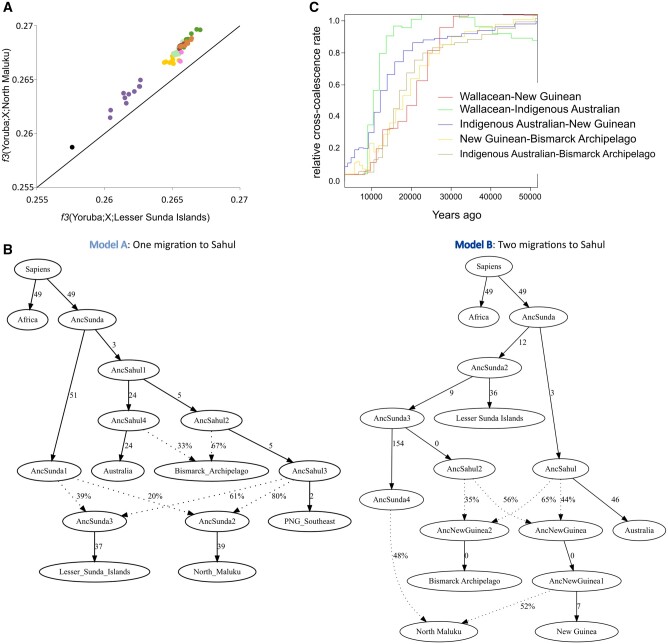
Fig. 2.
Scenario of the settlement of Sahul. (A) f3-outgroup analysis for all Sahul groups compared with populations from the North Maluku Islands (y axis) or Lesser Sunda Islands (x axis). Populations are identified by the same color scheme as in figure 1. (B) Best fitting qpGraph models considering one migration to Sahul (model A; Z score=−2.570) or two migrations to Sahul (model B; Z score = 2.301). One subgroup was used as representant of a region: populations from North Maluku (Wallacea subgroup 23, following fig. 1C and defined in supplementary table 2, Supplementary Material online), Lesser Sunda Islands (Wallacea subgroup 13), New Guinea (New Guinea subgroup 16), the Bismarck Archipelago (Bismarck subgroup 5), northeast Australia (Australia subgroup 1), and Africa (Africa_5). Solid arrows are labeled with branch lengths in 1,000 times drift units. Dotted arrows indicate gene flows whose proportions are indicated by percentages. (C) Relative cross-coalescence rate curves estimated by MSMC2 between populations from Wallacea (Lesser Sunda Islands, Wallacea subgroup 13), New Guinea (New Guinea subgroup 16), the Bismarck Archipelago (Bismarck subgroup 5), and northeast Australia (Australia subgroup 1).

