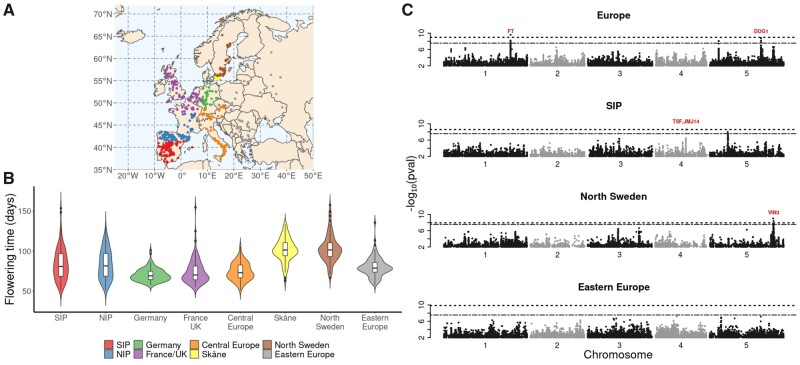
Fig. 1.
GWAS of flowering time across Europe. (A) Origin of the 888 European Arabidopsis thaliana accessions, with eight designated subpopulations in different colors. (B) The distribution of flowering time in the subpopulations. (C) Manhattan plots of GWAS results for the whole European populations and three of the eight subpopulations. Dashed and dash-dotted lines indicate Bonferroni- and permutation-based 5% significance thresholds, respectively. Candidate genes that are in close proximity to significantly associated markers are indicated in red.

