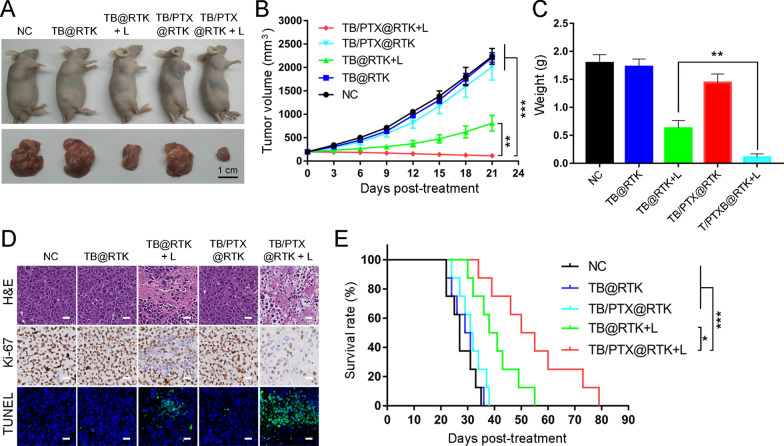
Fig. 5.
Anti-tumor efficacy of TB/PTX@RTK micelles in vivo. A Representative images of tumor-bearing mice and harvested tumors after various treatments. Scale bar: 1 cm. B Tumor volume at indicated time points after different treatments (n = 5 per group). Data represent mean ± SD. C Tumor weight at 21 days after different treatments. Data represent mean ± SD. D H&E staining for histological changes in Hep 1–6 tumor tissues after different treatments (upper row). Ki-67 expression detected by IHC in tumor tissues sections after different treatments (middle row). TUNEL assay for apoptosis levels in Hep 1–6 tumor tissues after different treatments (lower row). Scale bar: 20 μm. E Survival curves of Hep 1–6 tumor-bearing C57BL/6 mice in different treatment groups (n = 8 per group). *P < 0.05, ***P < 0.001

