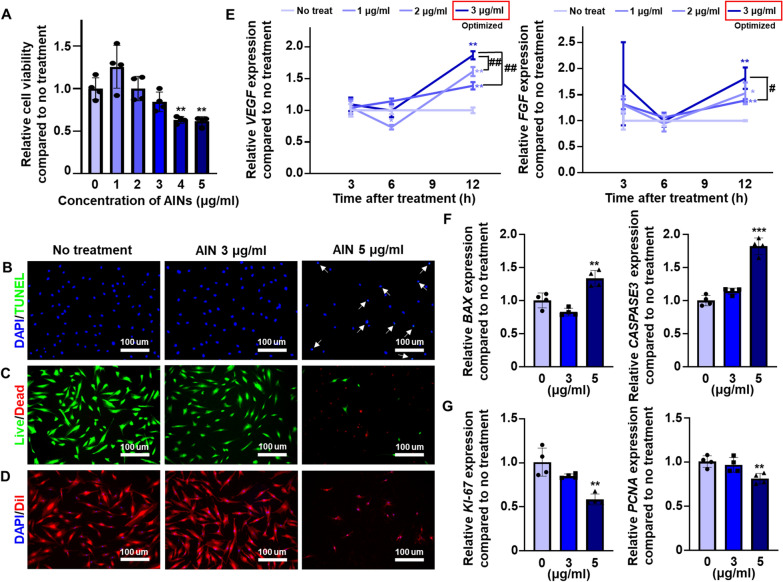
Fig. 2.
Optimization of the concentration of AINs used for treatment of L-ADSCs. A Cell viability of L-ADSCs after treatment with AINs (n = 4, **p < 0.01 versus no treatment group). B Terminal deoxynucleotidyl transferase-mediated dUTP nick end labeling (TUNEL) assay examining AIN treated L-ADSCs (blue: nucleus, green: apoptotic cell). White arrows indicate cells undergoing apoptosis that was induced by AINs. Scale bar: 100 μm. C Fluorescein diacetate/ethidium (FDA/EB) staining of L-ADSCs post-treatment with AINs (green: live cells, red: dead cells). Scale bar: 100 μm. D DiI staining of L-ADSCs treated with AINs (blue: nucleus, red: cellular membrane). Scale bar: 100 μm. E Relative mRNA expression levels of VEGF and FGF2 in L-ADSCs at 3, 6, 9, and 12 h after treatment with various concentration of AINs (n = 4, *p < 0.05 and **p < 0.01 versus no treatment group, #p < 0.05 and ##p < 0.01 versus each group). Relative mRNA expression of F the apoptosis-related genes BAX and CASPASE3 and G the proliferation-related genes KI-67 and PCNA in L-ADSCs after treatment with various concentrations of AINs (n = 3, **p < 0.01 and ***p < 0.001 versus no treatment group)

