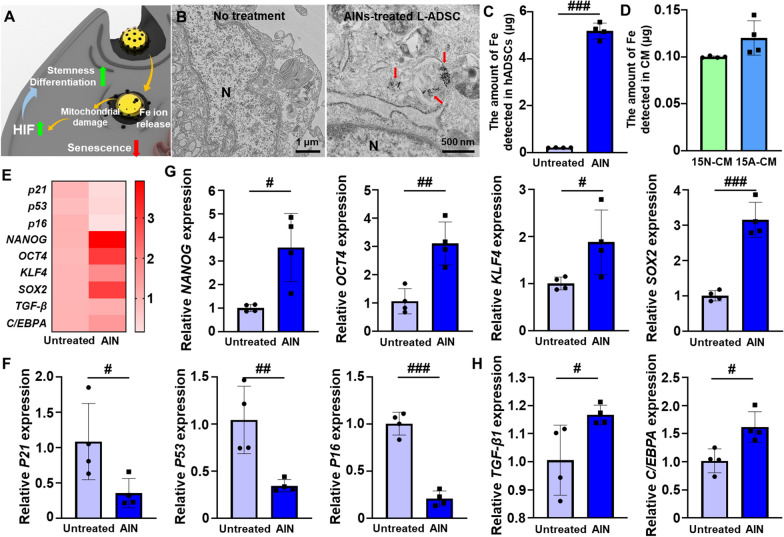
Fig. 3.
Cellular uptake and effects of AINs in L-ADSCs. A Schematic representation of the functionality-restoring effects of AINs. B TEM images of L-ADSCs after treatment with AINs for 12 h (N: nucleus, red arrow: intracellular AINs). C Mass detection of iron in L-ADSCs with or without AIN treatment as quantified using inductively coupled plasma optical emission spectrometer (ICP-OES; n = 4). D Mass detection of iron ions in CM harvested from L-ADSCs at passage 15 without AIN treatment (15 N-CM) and from L-ADSCs at passage 15 with AIN treatment (15 A-CM) as quantified by ICP-OES (n = 4). E Heat map image of the expression levels of senescence-related and stemness-related genes. F Relative mRNA expression of the senescence-related genes P21, P53, and P16 in L-ADSCs with or without AINs treatment (n = 4). G Relative mRNA expression of the stemness-related genes NANOG, OCT4, KLF4, and SOX2 in L-ADSCs with or without AIN treatment (n = 4). H Relative mRNA expression of chondrogenesis-related and adipogenesis-related genes in L-ADSCs with or without AIN treatment (n = 4). (#p < 0.05, ##p < 0.01, and ###p < 0.001 versus each group)

