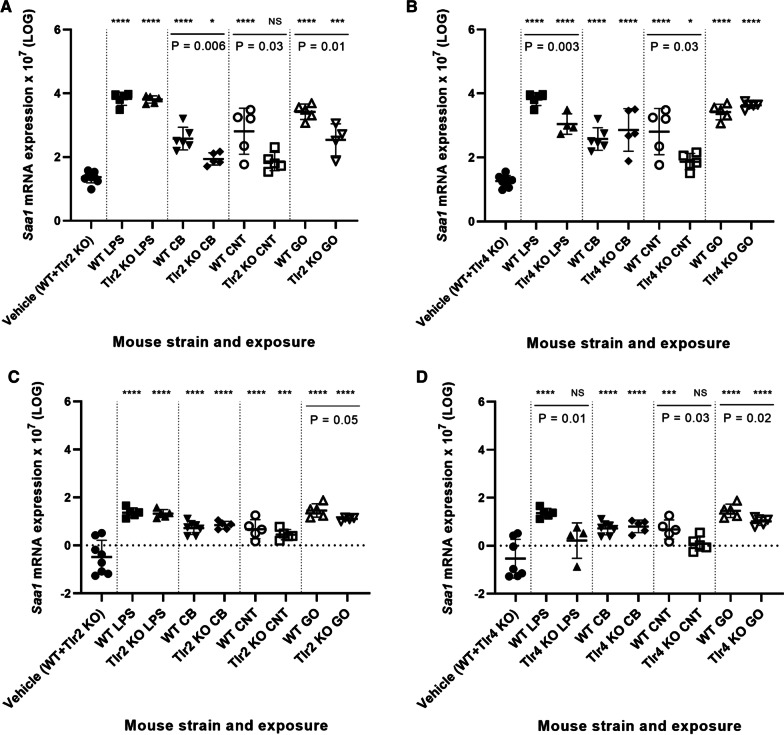
Fig. 6.
Hepatic mRNA expression levels of Saa1 in Tlr2 KO mice versus WT mice (A) and Tlr4 KO mice versus WT mice (B). Pulmonary mRNA expression levels of Saa1 in Tlr2 KO mice versus WT mice (C) and Tlr4 KO mice versus WT mice (D). All values are log transformed and presented as mean ± SD. A marker (*) denotes P ≤ 0.05, (**) P ≤ 0.01, (***) P ≤ 0.001, (****) P ≤ 0.0001 compared to vehicle control (Dunn’s multiple comparison method). The vertical lines mark statistically significant differences between KO mice and WT mice (unpaired t-test)

