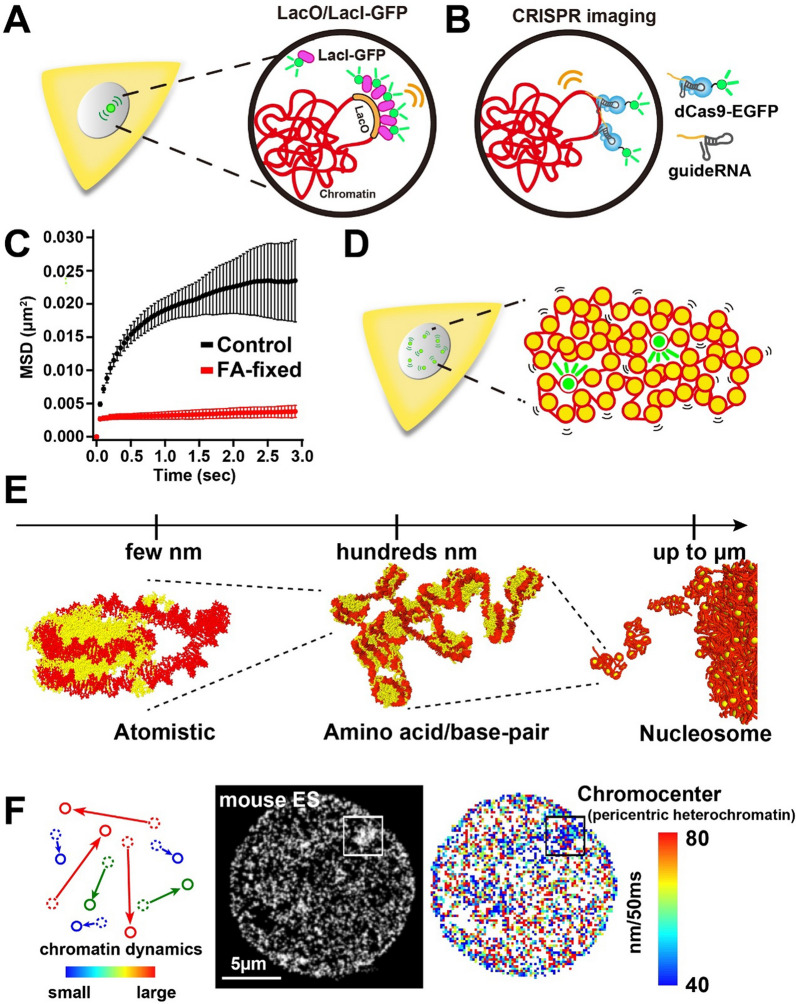
Fig. 9.
Visualization of dynamic chromatin motion. Schemes for LacO/LacI-GFP (A) and CRISPR-based chromatin labeling (B). C Constrained diffusion motion of chromatin: mean square displacement (MSD) plots (± SD among cells) of single nucleosomes in living (black) and formaldehyde-fixed (red) human RPE-1 cells over time (0.05 to 3 s) (data from [185]). D Scheme for single-nucleosome tracking. A small number of nucleosomes are labeled with photoactivatable GFP or other fluorescent tag to get sparse labeling. E Multiscale model of chromatin integrating three resolutions: atomistic (left), amino acid/base pair (center), and nucleosome (right) [128]. These models allow the exploration into how atomistic and residue level variations affect the structure and dynamics of chromatin fibers and domains. Illustration was reproduced from [189]. F (left) Scheme of chromatin heat map. In the heat map, small movements for 50 ms are shown in blue, and large movements are shown in red. (center) PALM (photo-activated localization microscopy) super resolution image and the chromatin heat map of a living mouse ES (embryonic stem) cell (right). Heterochromatin regions (nuclear periphery and pericentromeric heterochromatin) show dark blue. Data reproduced from [133]

