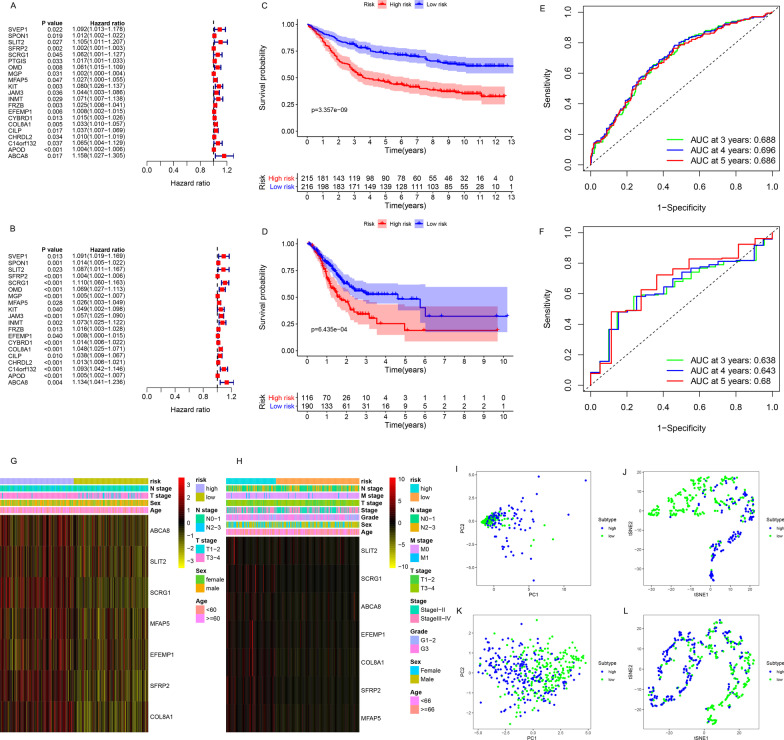
Fig. 6.
Construction and evaluation of a prognostic risk scoring model. Univariate analysis of the a training and b validation sets. Kaplan–Meier analysis of the c training and d validation sets. ROC curves of the e training and f validation sets for predicting 3-, 4-, and 5-year OS. The expression of seven genes and the proportion of clinicopathological features in the high- and low-risk groups were visualized in both g training and h validation sets. Clustering of patients belonging to high- and low-risk groups in the i, j training and k, l validation sets based on PCA and tSNE algorithm

