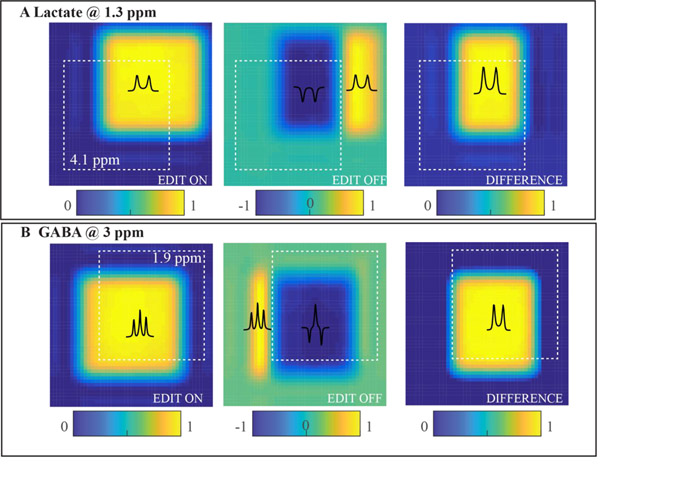
Figure 1. Effect of CSDE on editing efficiency for PRESS editing of lactate (TE = 144 ms) and GABA (TE = 70 ms).
(A) Numerical simulations of the 2D signal distribution of 1.3 ppm lactate resonance (a coupled spin at 4.1 ppm 2D distribution is depicted by the white dashed box). The 2D plane represents two spatial dimensions selected by two 180° localization RF pulses (1 kHz refocusing bandwidth). While severe spatial misregistration between two coupled spins is evident during the EDIT ON scan, the overall signal intensity is relatively uniform. This is due to the editing RF pulses refocusing voxel compartments that did not experience the effect of the 180° localization pulses. However, for the EDIT OFF case, one can observe distinct compartments where the spins of interest exhibit phases opposite that of the theoretical non-localized dual spin-echo experiment.124 (B) Numerical simulations of the 2D signal distribution of 3.0 ppm GABA resonance (coupled spins at 1.9 ppm 2D distribution is depicted by the white dashed box). The same dynamics are observed for GABA editing, albeit to the less extent due to smaller frequency difference between GABA coupled spins compared to lactate. Image intensity represents the integral of doublets of lactate or two outer peaks of GABA signals and color bars indicate respective intensity ranges. The significant reduction of the signal intensity in the final DIFFERENCE spectra (e.g., ~50% for lactate, ~20% for GABA) due to CSDE is observed at 3T.

