
FIGURE 3.
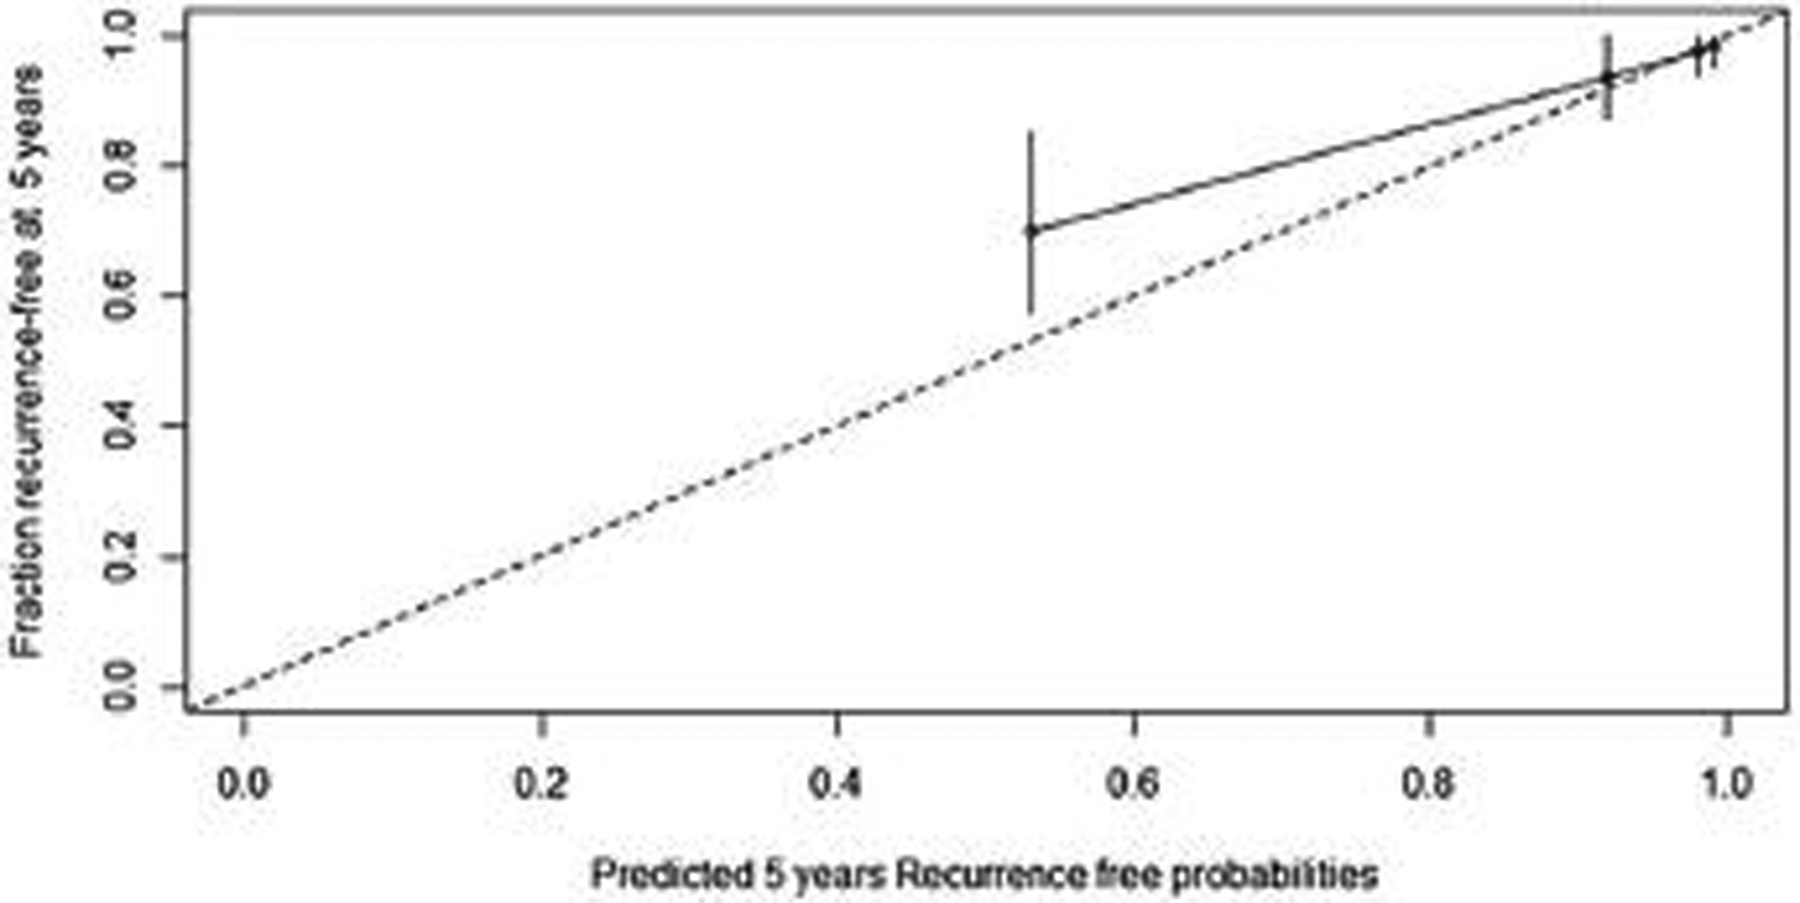
Calibration plot for predction of of 5-year recurrence-free survival on external cohort. The x-axis represents the nomogram-predicted probability of RFS and the y-axis represents the observed fraction with evidence of RFS. Perfect prediction corresponds to the 45° line. Points estimated below the 45° line correspond to nomogram overall prediction whereas points situated above the 45° line correspond to nomogram under prediction.