
Fig. 3.
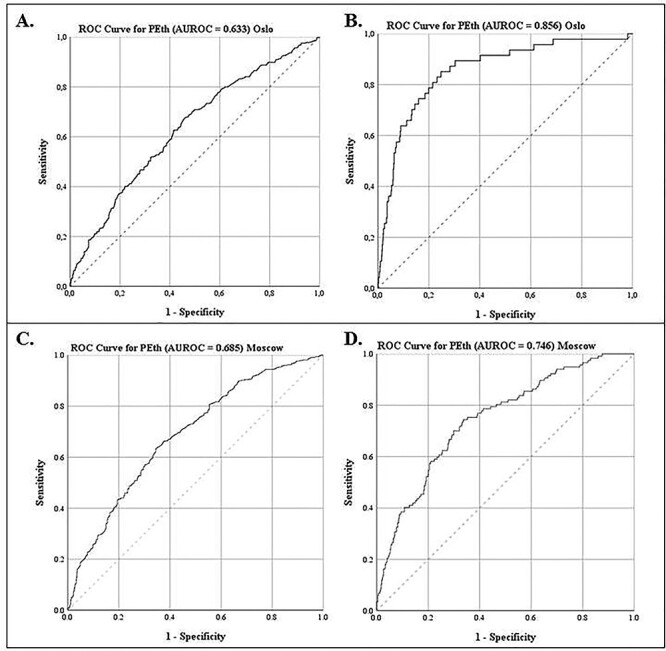
ROC curves for PEth predicting harmful alcohol use by AUDIT-QF (cutoff ≥ 5 (men) / ≥ 4 (women)) (A and C) and weekly grams of alcohol (cutoff ≥ 350 g) (B and D) (top panel: Oslo, bottom panel: Moscow).
A. Predictive accuracy of PEth (≥0.030 μM) with area under the ROC curve of 0.633 for harmful alcohol consumption using AUDIT-QF as reference (Oslo). B. Predictive accuracy of PEth (≥0.030 μM) with an area under the ROC curve of 0.856 for harmful alcohol consumption using weekly grams of alcohol as reference (Oslo). C. Predictive accuracy of PEth (≥0.030 μM) with area under the ROC curve of 0.685 for harmful alcohol consumption using AUDIT-QF as reference (Moscow). D. Predictive accuracy of PEth (≥0.030 μM) with an area under the ROC curve of 0.746 for harmful alcohol consumption using weekly grams of alcohol as reference (Moscow).