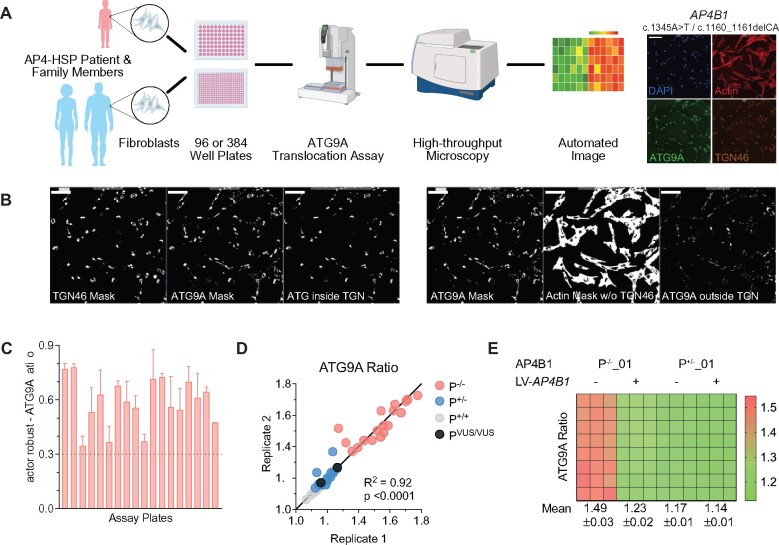
Figure 3.
Development of a high-throughput ATG9A translocation assay to determine AP-4 function. (A) Schematic overview of the high-throughput assay and workflow. Fibroblasts are derived by a routine skin punch biopsy, cultured and plated in 96- or 384-well plates. Cells are stained for DAPI (nuclear marker), actin (cytoplasmic marker), TGN46 (trans-Golgi network marker) and ATG9A. Plates are then subjected to confocal microscopy using a high-content imager and analysed using an automated image analysis pipeline. This figure was, in part, created with BioRender.com. (B) Automated image analysis to determine the ATG9A ratio on the level of individual cells. First cells are identified and outlined based on the presence of a DAPI-positive nucleus inside a phalloidin (actin marker)-positive area. Next, different masks are generated: an actin mask to outline the cell, a TGN46 mask to outline the area of the trans-Golgi network, and an ATG9A mask based on intracellular ATG9A fluorescence. ATG9A fluorescence intensity is then measured inside the TGN mask as well as inside the actin-staining positive cytoplasm outside the trans-Golgi network (a mask generated by subtracting the TGN46 mask from the actin mask). The ATG9A ratio is calculated for each cell by dividing the ATG9A fluorescence in both compartments. (C) Z′-factor robust scores for the ATG9A ratio show a robust separation of positive (P−/−) and negative controls (P+/−) and meet a predefined threshold of 0.3 in all assay plates. (D) Replicate plot showing the distribution of ATG9A ratio levels for each of two assay plates (biological replicates) in fibroblasts from patients with AP-4-HSP and biallelic loss-of-function variants (P−/−, Table 1), asymptomatic, heterozygous controls (P+/−), healthy unrelated controls (P+/+, Supplementary Table 2), and two individuals with novel biallelic missense variants in AP4B1 (novel variants, Table 1, Supplementary Table 1). Correlation analysis of 36 pairs shows a Pearson correlation coefficient of 0.95 with a P-value of <0.0001. (E) Heatmap of the ATG9A ratio in a 96-well plate with fibroblasts from patient P−/−_01 with biallelic truncating variants in AP4B1 and a heterozygous control (P+/−_01) in the absence and presence of lentivirus to re-express the missing AP4B1 subunit. Re-expression over 24 h restores the ATG9A ratio close to that of controls indicating that the ATG9A assay can detect dynamic changes in AP-4 function.

