Figure 4.
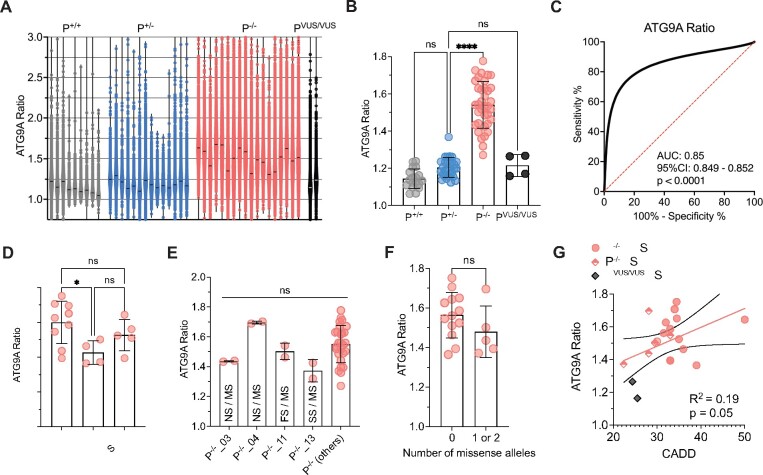
Validation of the ‘ATG9A ratio’ as an indicator of AP-4 function and a diagnostic marker for AP-4-HSP. (A) Violin plots showing the distribution of data points for each fibroblast line with a mean of 6765 ± 4536 (SD) cells from two assay plates for each cell line. Each data point corresponds to the ATG9A ratio of a single fibroblast. Horizontal lines indicate the median (334 data points are outside the axis limits). (B) Grouped analysis of the mean ATG9A ratio of all assay plates demonstrates a significant increase of the ATG9A ratio in AP-4-HSP patients with biallelic loss-of-function variants (P−/−) compared to heterozygous carriers (P+/−) (Kruskal–Wallis test with Dunn’s multiple comparisons test, P < 0.0001). ATG9A ratios of the two individuals with novel biallelic missense variants in AP4B1 (PVUS/VUS) and that of healthy controls (P+/+) are not significantly different from heterozygous controls. Each data point represents the mean ATG9A ratio of each assay plate. (C) Receiver-operating characteristic (ROC) curve for the pooled ATG9A ratio data of all AP-4-HSP patients with biallelic loss-of-function variants (P−/−, n = 160 229 cells) versus heterozygous carriers (P+/−, n = 86 691 cells) shows an area under curve (AUC) of 0.85 with a 95% confidence interval between 0.8488 and 0.8519 and a P-value of <0.0001. (D) Grouped analysis of the mean ATG9A ratios of AP-4-HSP patients with biallelic loss-of-function variants (P−/−) separated by their AP-4-HSP subtype shows that patients with AP4M1-associated SPG50 have lower mean ATG9A ratios compared to AP4B1-associated SPG47 (Kruskal–Wallis test with Dunn’s multiple comparisons test, P < 0.05). Each data point represents the mean ATG9A ratio of each assay plate. (E) Mean ATG9A ratios of three individuals with missense variants previously classified as variant of unclear significance by ACMG criteria, in trans with pathogenic variants, are not different compared to patients with biallelic variants classified as pathogenic or likely pathogenic. Similarly, the mean ATG9A ratio of fibroblasts from an individual with a novel missense variant in trans with a novel splice-site variant (P−/−_13), both previously classified as of uncertain significance, is not significantly different. This confirms the detrimental impact of these variants on AP-4 function (Kruskal-Wallis test with Dunn’s multiple comparisons test, P > 0.05). Each data point represents the mean ATG9A ratio of each assay plate. FS, frameshift variant; NS, nonsense variant; MS, missense variant; SS, splice site variant. (F) Analysis of the mean ATG9A ratio from AP-4-HSP patients with biallelic loss-of-function variants grouped by the presence or absence of alleles with missense variants. While there is a trend towards lower ATG9A ratios in patients with 1 or 2 missense variants, this did not reach statistical significance (Mann–Whitney test, P = 0.23). Each data point represents the mean ATG9A ratio of each assay plate. (G) ATG9A ratio levels in correlation to CADD scores in individuals with biallelic loss-of-function variants with no missense variant (red circles represent the mean of the CADD scores from both alleles), biallelic loss-of-function variants with a missense variant on one allele (diamonds half-filled with red represent CADD score of the missense variant) and individuals with novel biallelic missense variants (PVUS/VUS_01 and PVUS/VUS_02, grey diamonds represent missense variant with the lowest CADD score). There is a trend towards a correlation that does not however reach statistical significance (Pearson correlation coefficient: r = 0.19, P = 0.05). Each data point represents the mean ATG9A ratio of each assay plate. *P < 0.05; ****P < 0.0001.

