Fig. 1.

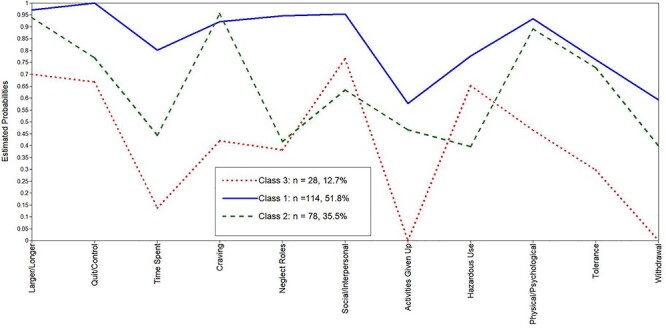
Profiles of AUD using conditional probabilities. Note. On the x-axis of the graph are the 11 AUD items and the conditional probability of endorsing each item is on the y-axis.

Profiles of AUD using conditional probabilities. Note. On the x-axis of the graph are the 11 AUD items and the conditional probability of endorsing each item is on the y-axis.