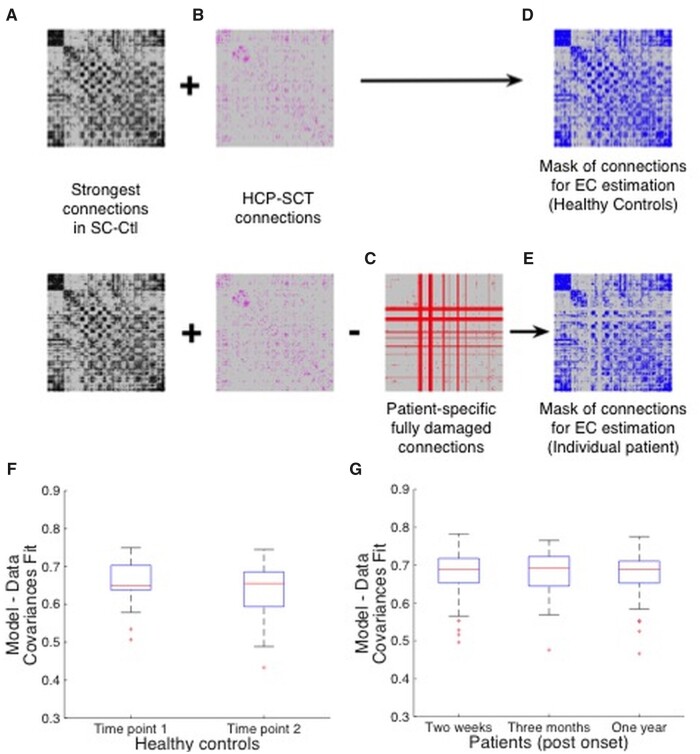
Figure 1.
Masks of structural links used in estimating the effective connectivity. For healthy controls, the mask shown in D is the union of links stronger than 0.5% of the strongest value in the SC_Ctl, shown in A, matrix averaged across healthy control participants (SC_Ctl, see Materials and methods section), and existing links in the HCP-SCT, shown in B. From this mask, we remove all links that are completely damaged by the lesion in an individual patient, shown in C, to find an individualized mask for the patient, shown in E. (F and G) Box plots of Pearson correlation values between the empirical and model lagged and non-lagged co-variances for age- and education-matched healthy controls at two time-points, 3 months apart, shown in F and stroke patients at three time-points: 2 weeks, 3 months and 1 year post onset of stroke, shown in G.

