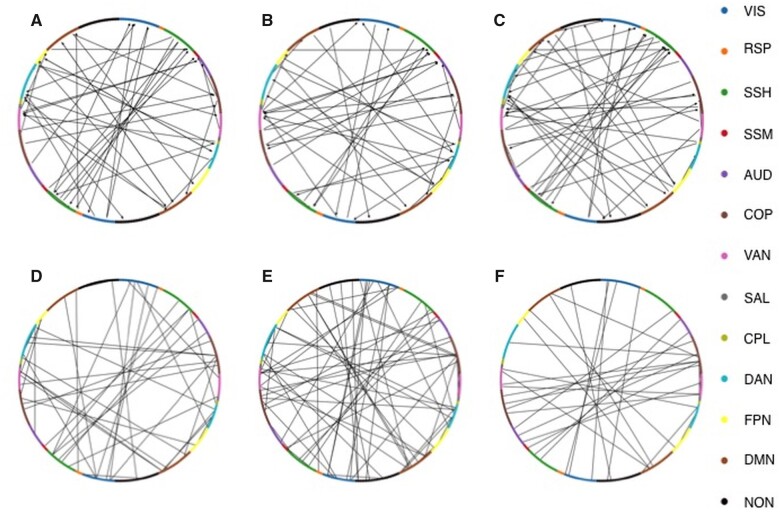
Figure 4.
Distribution of predictive links for distinguishing patients from healthy control in terms of RSNs and hemispheres. Predictive links according to RSNs for EC (top panels) and FC (bottom panels) for the classification of healthy controls versus stroke patients at each time-point (2 weeks, A and D; 3 months B and E; 1 year C and F). Arrows in the top panel figures show the directionality of interaction in the predictive EC links.

