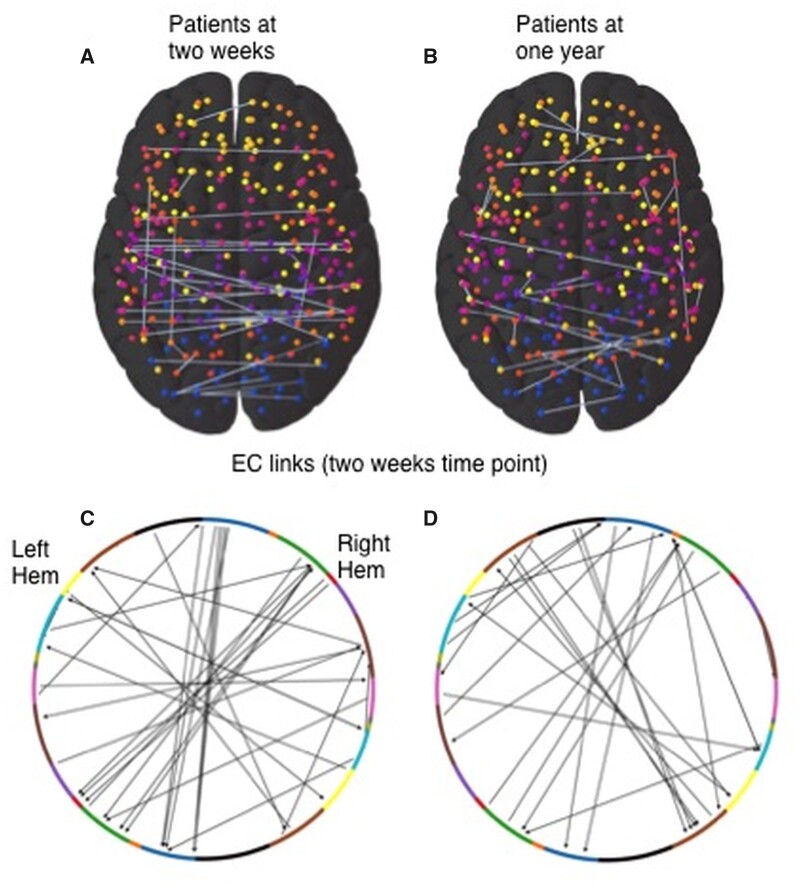
Figure 7.
Most predictive links for prediction of behavioural deficits in patients. A and B: Predictive links (top panels) and their distribution according to RSNs (bottom panels) from EC values at the 2-week time-point in classifying patients according to the number of behavioural deficits at the 2-week (A and C) and 1-year (B and D) time-points. Arrows in the bottom panel figures show the directionality of interaction in the predictive EC links.

