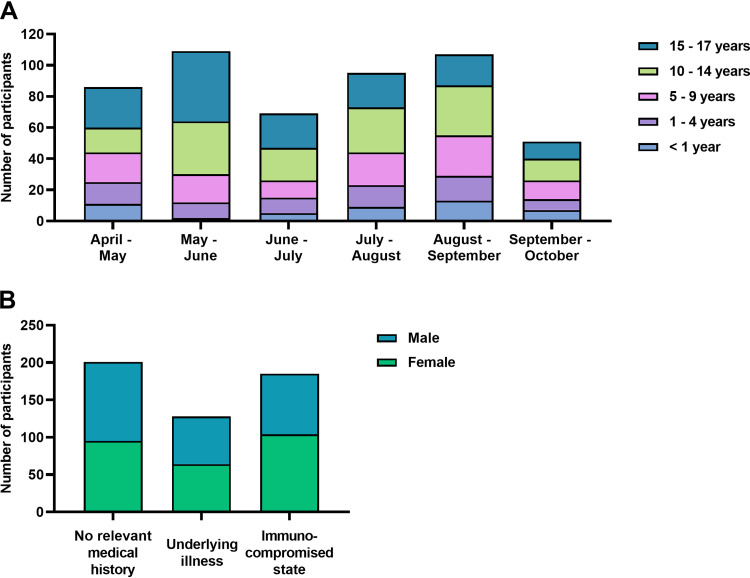
FIG 1.
Age distribution, comorbidity, and sex. (A) The distribution of age across the inclusion period of 24 weeks is depicted for the total number of cases (n = 517), with each bar representing 4 weeks. (B) Comorbidity and male/female ratio of the study sample is calculated for the nonmissing values (n = 514, excluding 3 missing values for comorbidity).

